Free Access
Fig. 2
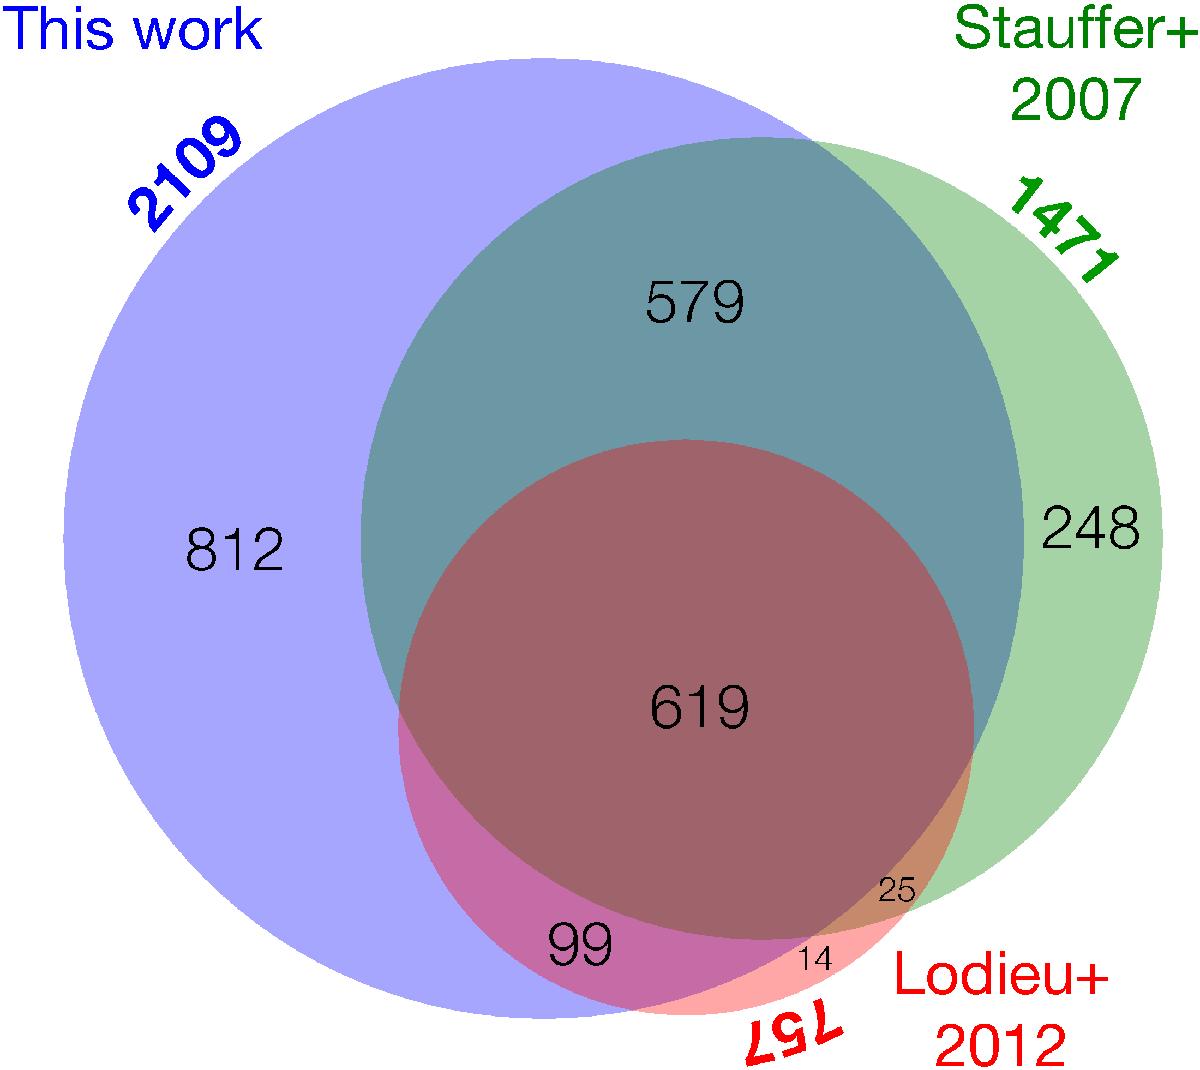
Venn diagram representing the sample of candidate members identified in the DANCe survey (blue), in Stauffer et al. (2007; green), and in Lodieu et al. (2012; red, probability greater than 50% in their analysis). In each case the total number is indicated in bold face outside the circles.
Current usage metrics show cumulative count of Article Views (full-text article views including HTML views, PDF and ePub downloads, according to the available data) and Abstracts Views on Vision4Press platform.
Data correspond to usage on the plateform after 2015. The current usage metrics is available 48-96 hours after online publication and is updated daily on week days.
Initial download of the metrics may take a while.