Fig. B.1
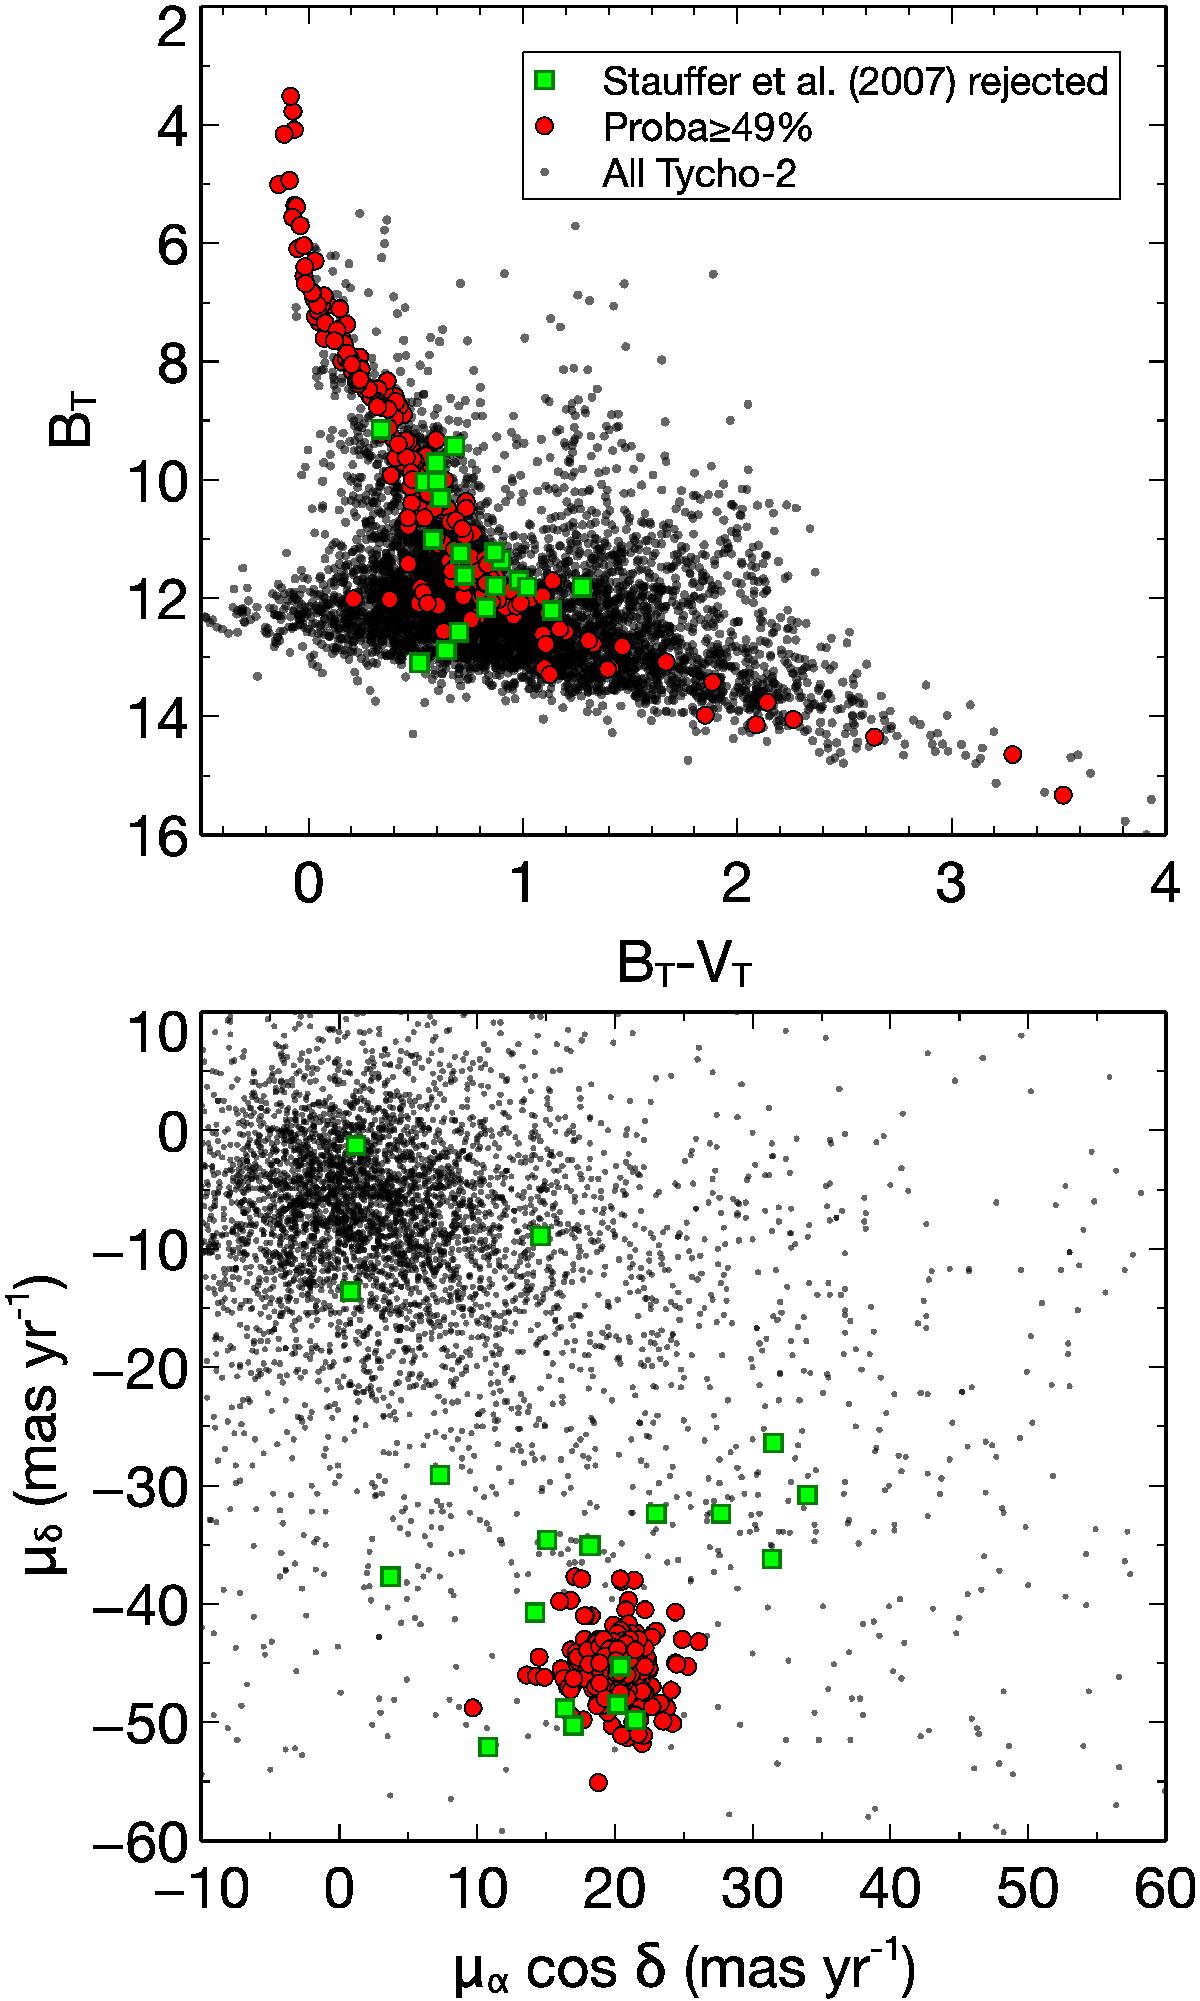
Upper panel: BT vs. BT − VT color–magnitude diagram of the Tycho-2 catalog in the area of the DANCe survey (black dots). New candidate members (with membership probability greater than of equal to 48%) are represented by red dots. Candidate members from Stauffer et al. (2007) that do not pass the selection criterion are represented by green squares. Lower panel: vector point diagram of the Tycho-2 catalog in the area of the DANCe survey. The color and symbol codes are the same.
Current usage metrics show cumulative count of Article Views (full-text article views including HTML views, PDF and ePub downloads, according to the available data) and Abstracts Views on Vision4Press platform.
Data correspond to usage on the plateform after 2015. The current usage metrics is available 48-96 hours after online publication and is updated daily on week days.
Initial download of the metrics may take a while.