Fig. 11
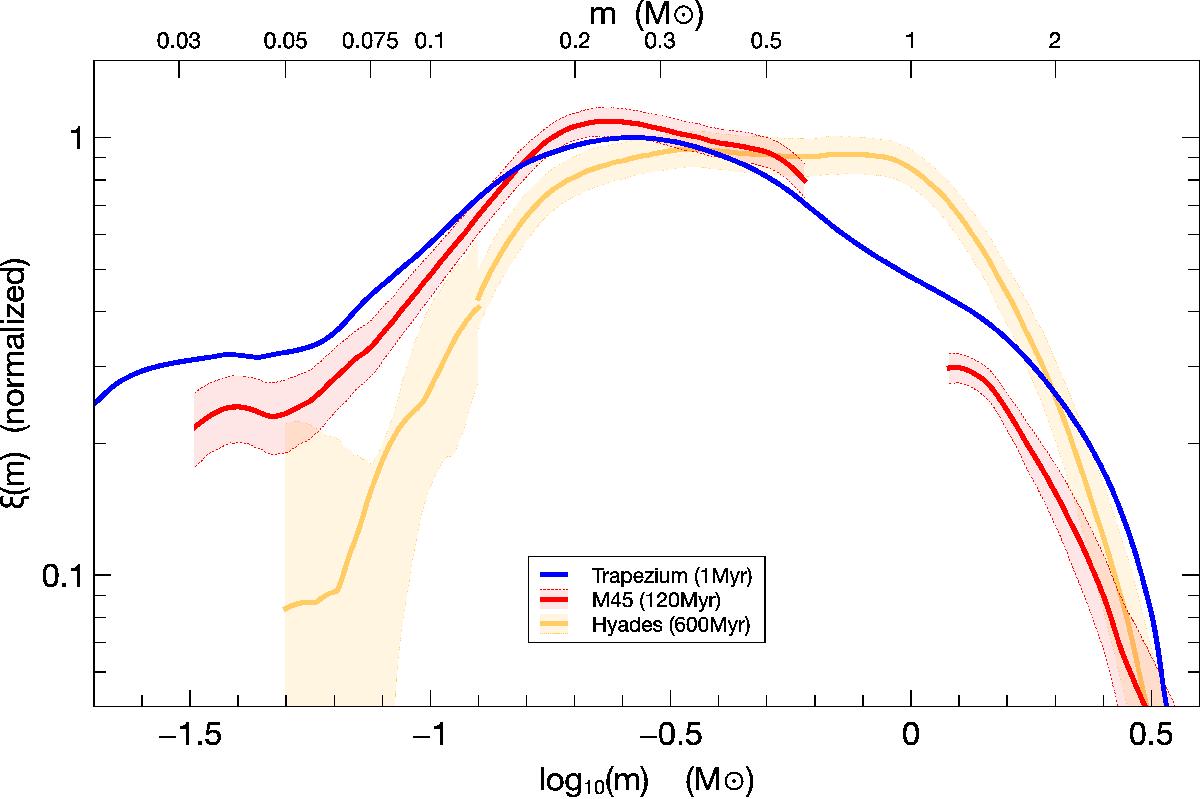
Observed present-day system mass function of the Pleiades within the central 3° radius (red), compared to the measurements reported for the Trapezium cluster by Muench et al. (2002) and Hillenbrand & Carpenter (2000; blue) and the Hyades (orange) from Goldman et al. (2013; down to 0.15 M⊙) and Bouvier et al. (2008) in the range 0.05 ≤ M ≤ 0.15 M⊙.
Current usage metrics show cumulative count of Article Views (full-text article views including HTML views, PDF and ePub downloads, according to the available data) and Abstracts Views on Vision4Press platform.
Data correspond to usage on the plateform after 2015. The current usage metrics is available 48-96 hours after online publication and is updated daily on week days.
Initial download of the metrics may take a while.