Free Access
Fig. 1
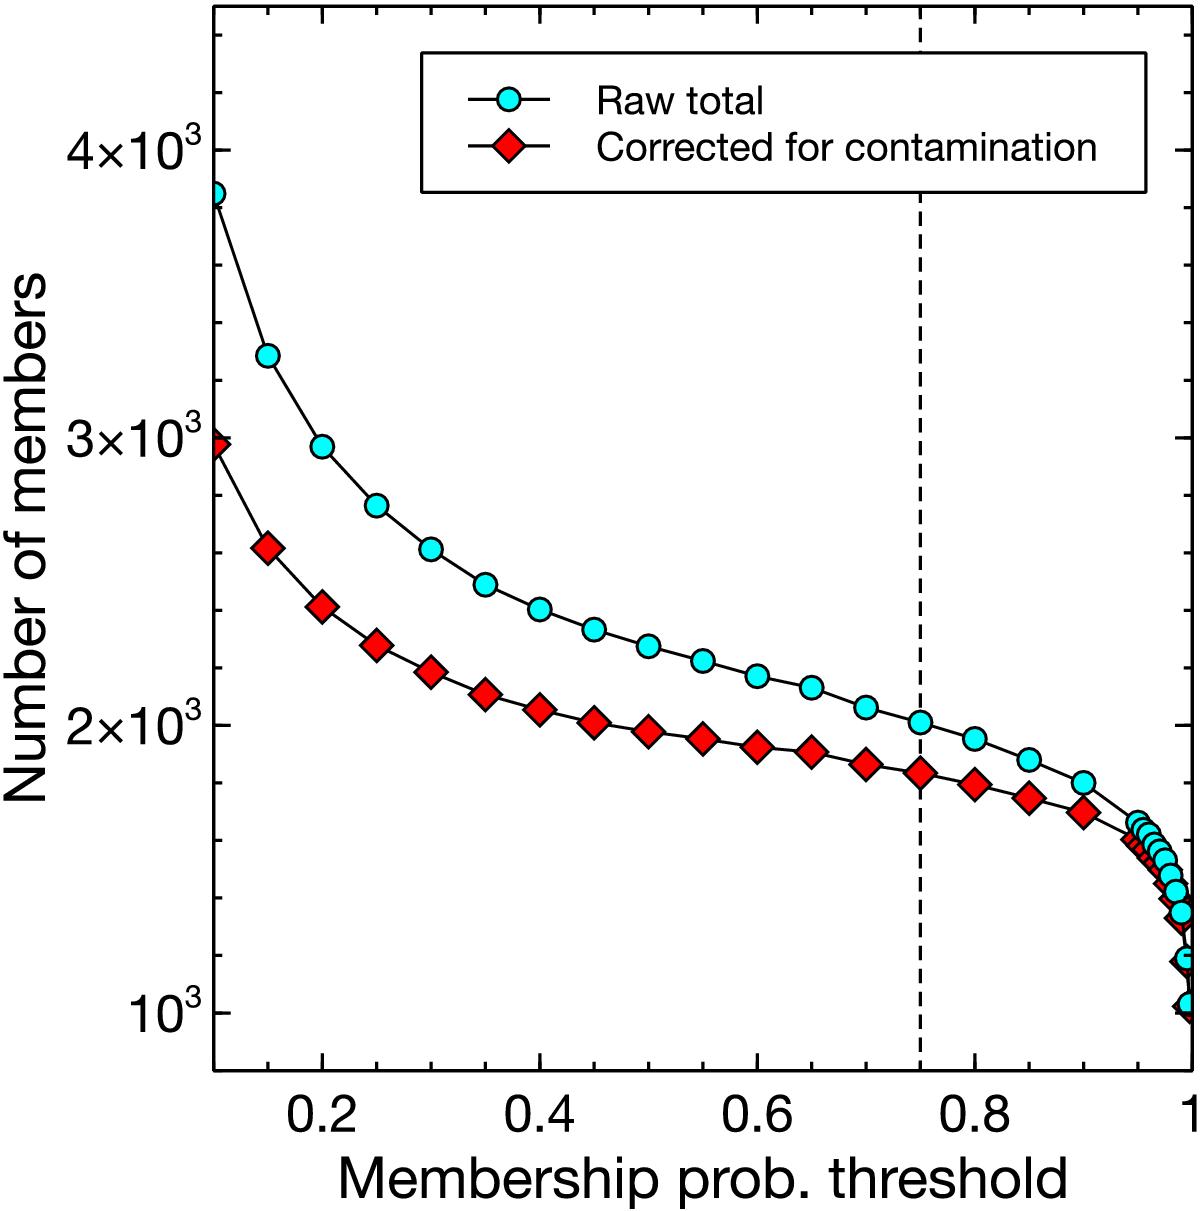
Sample size (not including the Tycho-2 analysis) as a function of the membership probability threshold. The raw (cyan) and corrected-for contamination (red) values are indicated. A dotted line indicates the 0.75 level chosen for the present study.
Current usage metrics show cumulative count of Article Views (full-text article views including HTML views, PDF and ePub downloads, according to the available data) and Abstracts Views on Vision4Press platform.
Data correspond to usage on the plateform after 2015. The current usage metrics is available 48-96 hours after online publication and is updated daily on week days.
Initial download of the metrics may take a while.