Fig. 3
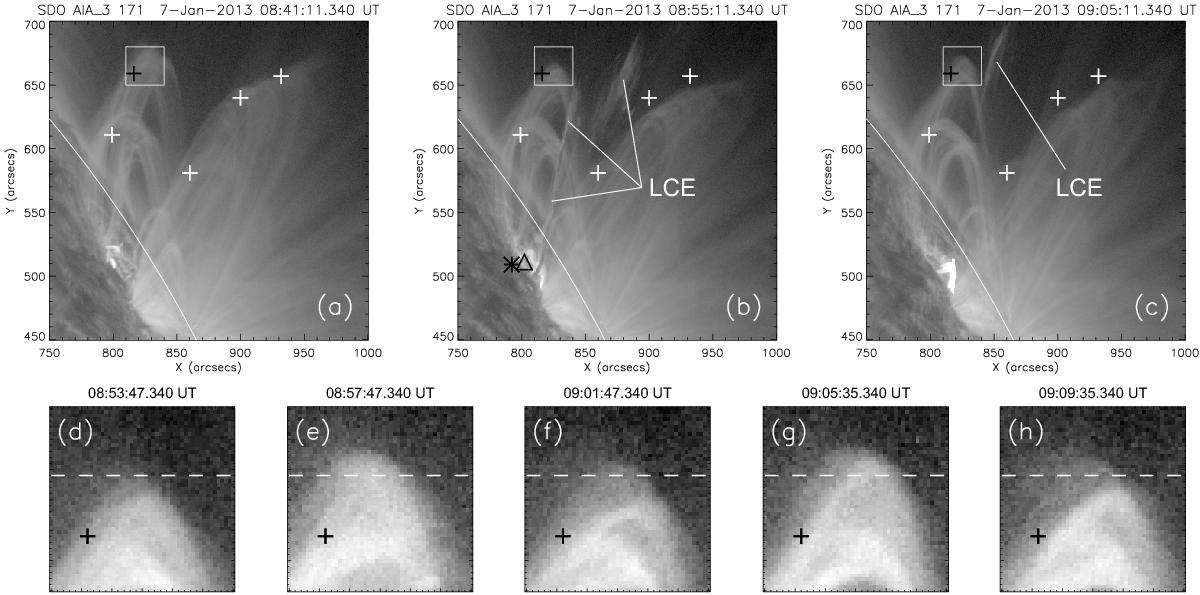
Sequence of AIA 171 Å images taken during event N 44. Crosses indicate the positions of the oscillating loops found with JHelioviewer and shown in Col. 4 of Table 1. The black asterisk and triangle indicate positions of the flare and the starting point of the LCE, given in Cols. 7 and 12 of Table 1, respectively. The white square boxes in the upper images show the region that is zoomed in the lower row of panels. The solar limb is shown by the thin white curve. Solar coordinates of the black cross in all images are the same. The dashed horizontal line is an arbitrary reference level to highlight the oscillatory behaviour of the loops.
Current usage metrics show cumulative count of Article Views (full-text article views including HTML views, PDF and ePub downloads, according to the available data) and Abstracts Views on Vision4Press platform.
Data correspond to usage on the plateform after 2015. The current usage metrics is available 48-96 hours after online publication and is updated daily on week days.
Initial download of the metrics may take a while.