Free Access
Fig. 1
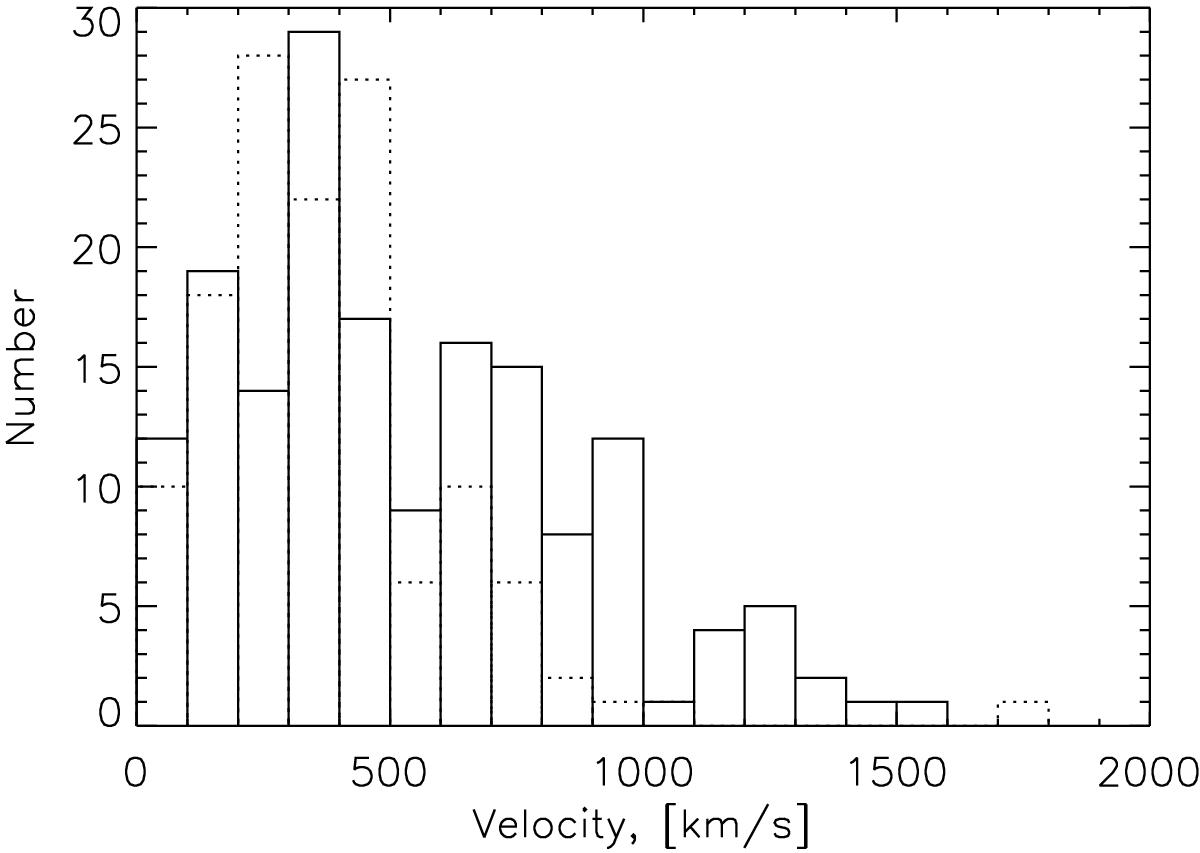
Distributions of the speeds required for hypothetical agents exciting kink oscillations of coronal loops to reach the oscillation sites from the starting point of the lower coronal eruptions/ejections (vLCE, solid line) and the location of the flares (vflare, dotted lines).
Current usage metrics show cumulative count of Article Views (full-text article views including HTML views, PDF and ePub downloads, according to the available data) and Abstracts Views on Vision4Press platform.
Data correspond to usage on the plateform after 2015. The current usage metrics is available 48-96 hours after online publication and is updated daily on week days.
Initial download of the metrics may take a while.