Fig. 4
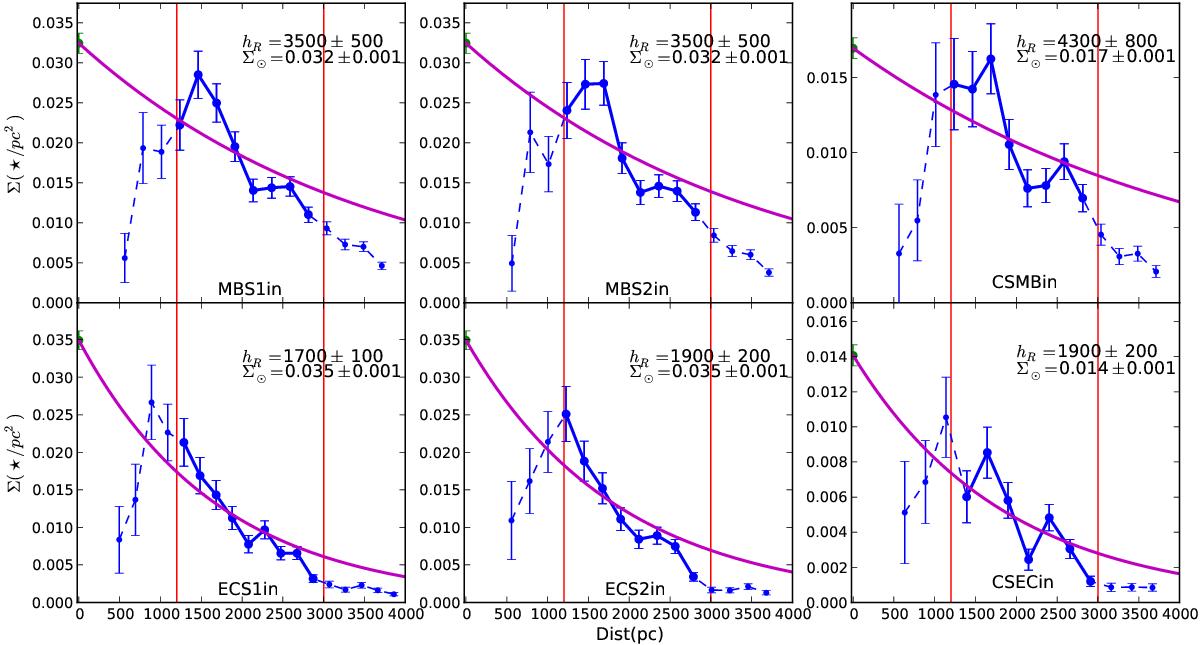
Radial variation of the stellar surface density for the MB (top) and EC (bottom) samples in blue. Vertical red lines show the 1.2 and 3 kpc completeness limits. The exponential fit is plotted in magenta, with the hR and Σ⊙ parameters expressed in pc and ⋆/pc2, respectively. Blue dots joined with solid lines are the ones used for the fit, since it is the region where completeness is ensured.
Current usage metrics show cumulative count of Article Views (full-text article views including HTML views, PDF and ePub downloads, according to the available data) and Abstracts Views on Vision4Press platform.
Data correspond to usage on the plateform after 2015. The current usage metrics is available 48-96 hours after online publication and is updated daily on week days.
Initial download of the metrics may take a while.