Fig. 2
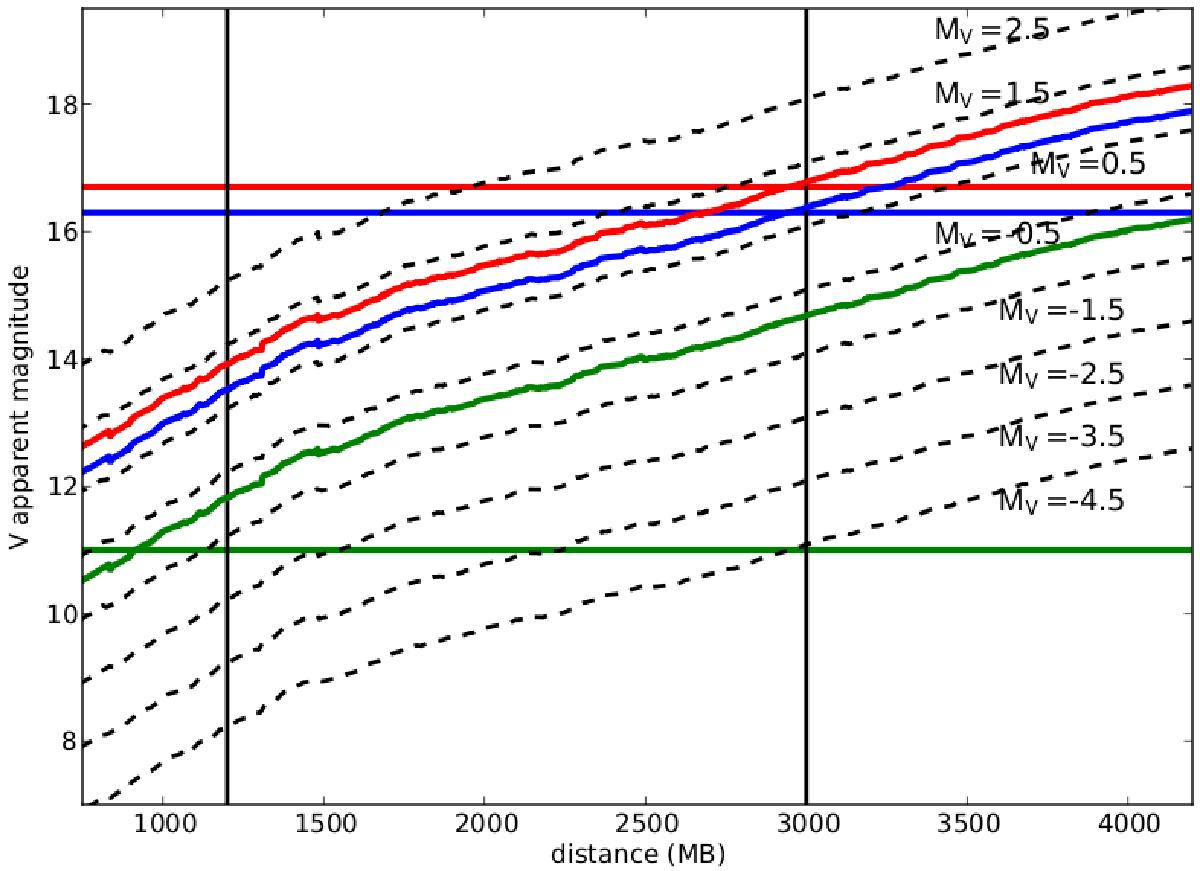
Observed apparent magnitude for different absolute magnitude stars located at different distances. We have assumed an absorption of ![]() obtained from our data using the MB method. Vertical lines show the established limits at 1.2 and 3 kpc. Horizontal lines show the Vlim computed for different working samples. In red,
obtained from our data using the MB method. Vertical lines show the established limits at 1.2 and 3 kpc. Horizontal lines show the Vlim computed for different working samples. In red, ![]() and
and ![]() for MB-S1 and MB-S2 samples. In blue,
for MB-S1 and MB-S2 samples. In blue, ![]() and
and ![]() for CS-MB. In green,
for CS-MB. In green, ![]() and
and ![]() computed using
computed using ![]() .
.
Current usage metrics show cumulative count of Article Views (full-text article views including HTML views, PDF and ePub downloads, according to the available data) and Abstracts Views on Vision4Press platform.
Data correspond to usage on the plateform after 2015. The current usage metrics is available 48-96 hours after online publication and is updated daily on week days.
Initial download of the metrics may take a while.