Fig. 10
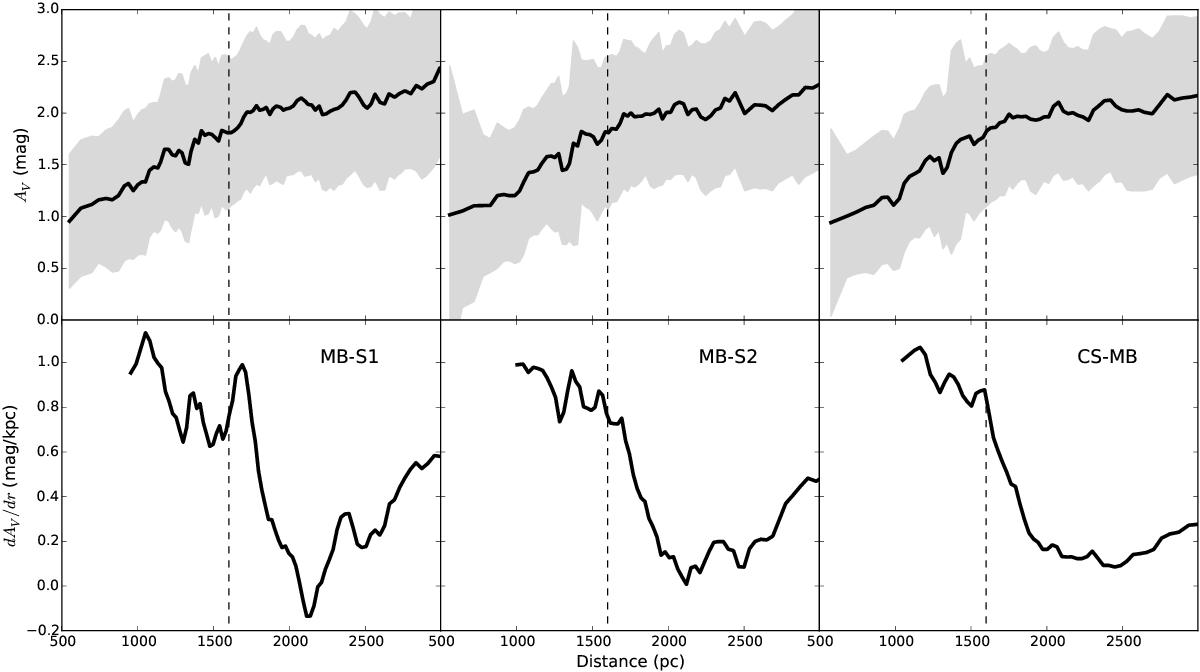
Top: running median of the visual absorption vs. heliocentric distance distribution obtained from the three different samples MB-S1 (left), MB-S2 (middle), and CS (right). The gray area indicates the error of the median computed as ![]() . Bottom: differential visual absorption showing the change in slope of the upper plots. Vertical dashed lines show the location of the Perseus arm at 1.6 kpc derived in Sect. 4.
. Bottom: differential visual absorption showing the change in slope of the upper plots. Vertical dashed lines show the location of the Perseus arm at 1.6 kpc derived in Sect. 4.
Current usage metrics show cumulative count of Article Views (full-text article views including HTML views, PDF and ePub downloads, according to the available data) and Abstracts Views on Vision4Press platform.
Data correspond to usage on the plateform after 2015. The current usage metrics is available 48-96 hours after online publication and is updated daily on week days.
Initial download of the metrics may take a while.