Free Access
Fig. 1
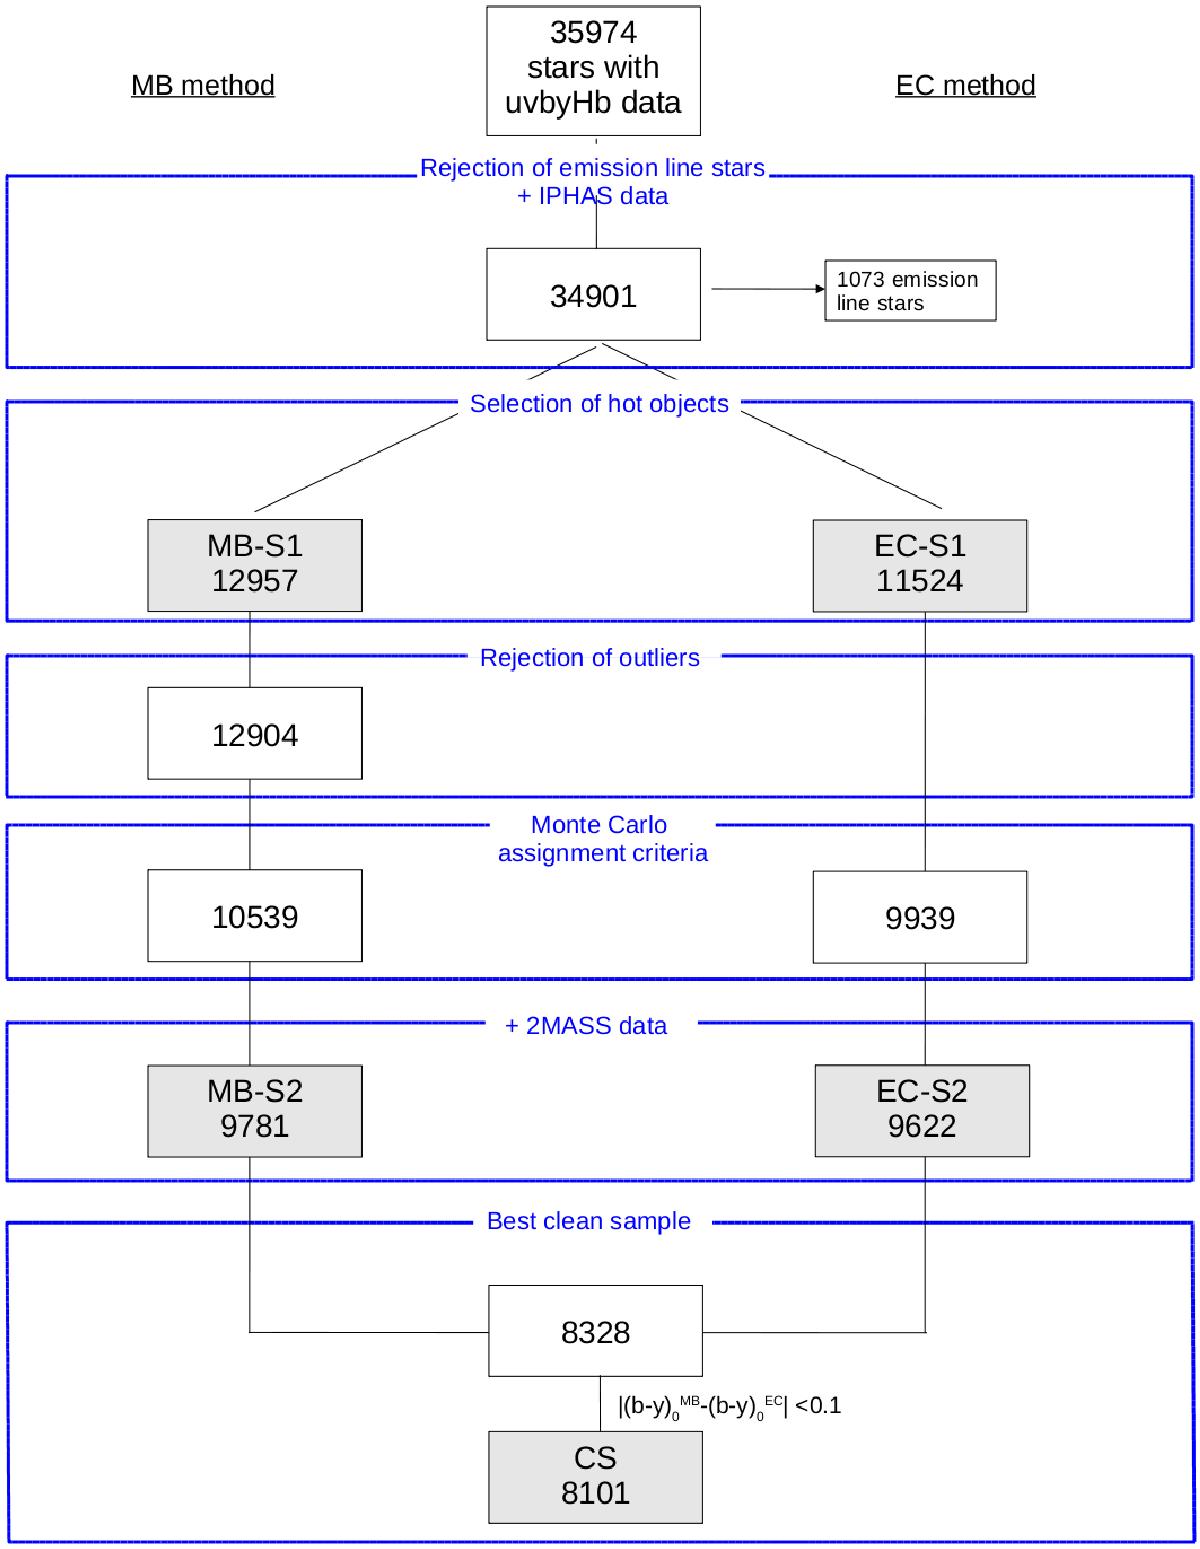
Procedure for the generation of the working samples. From top to bottom, the number of stars in the samples decreases while the quality of the individual physical parameters increases. The left side shows the samples according to the MB method, and the right side with EC.
Current usage metrics show cumulative count of Article Views (full-text article views including HTML views, PDF and ePub downloads, according to the available data) and Abstracts Views on Vision4Press platform.
Data correspond to usage on the plateform after 2015. The current usage metrics is available 48-96 hours after online publication and is updated daily on week days.
Initial download of the metrics may take a while.