Fig. 1
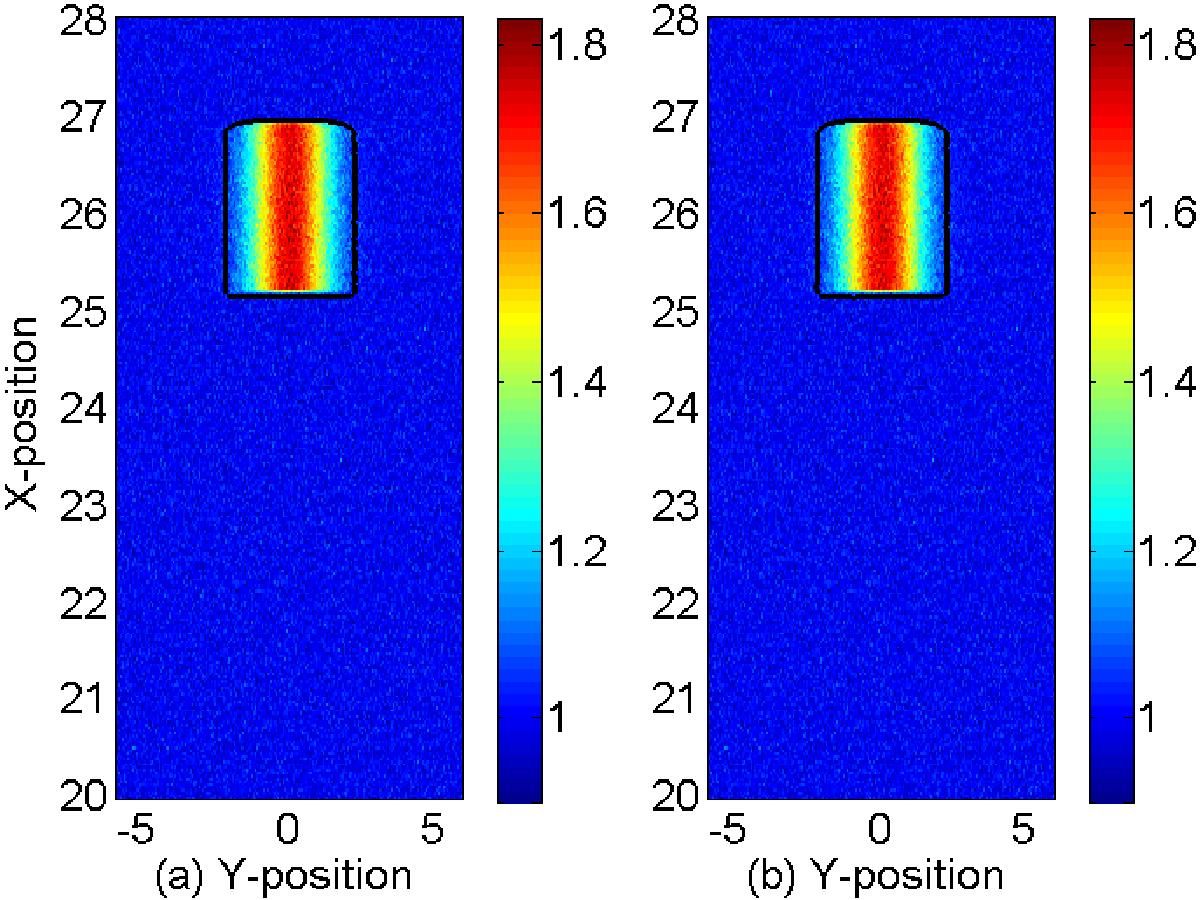
Lepton density distribution at the time t = 27.5. Panel a): normalized density nb(x,y) + ne(x,y) of the background electrons and the cloud’s electrons. Panel b): normalized density nb(x,y) + np(x,y) of the background electrons and the cloud’s positrons. The color scale is linear. The black curve outlines the contour where the lepton cloud’s number density is 0.06 n0.
Current usage metrics show cumulative count of Article Views (full-text article views including HTML views, PDF and ePub downloads, according to the available data) and Abstracts Views on Vision4Press platform.
Data correspond to usage on the plateform after 2015. The current usage metrics is available 48-96 hours after online publication and is updated daily on week days.
Initial download of the metrics may take a while.