Free Access
Fig. 1
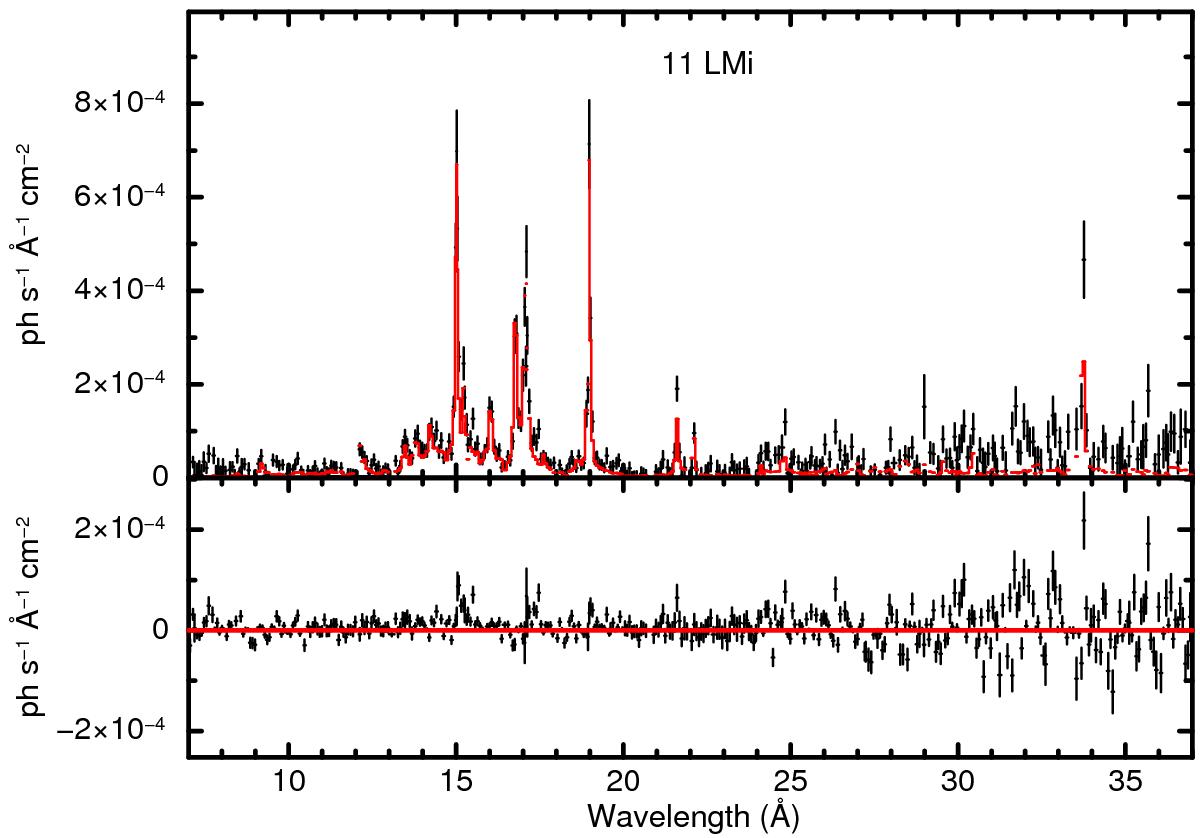
RGS spectrum of 11 LMi between 7−37 Å (data points) and best-fit model (red solid line). Residuals are plotted in the bottom panel. The data in the figure are rebinned to 3σ, but not more than three bins.
Current usage metrics show cumulative count of Article Views (full-text article views including HTML views, PDF and ePub downloads, according to the available data) and Abstracts Views on Vision4Press platform.
Data correspond to usage on the plateform after 2015. The current usage metrics is available 48-96 hours after online publication and is updated daily on week days.
Initial download of the metrics may take a while.