Fig. 3
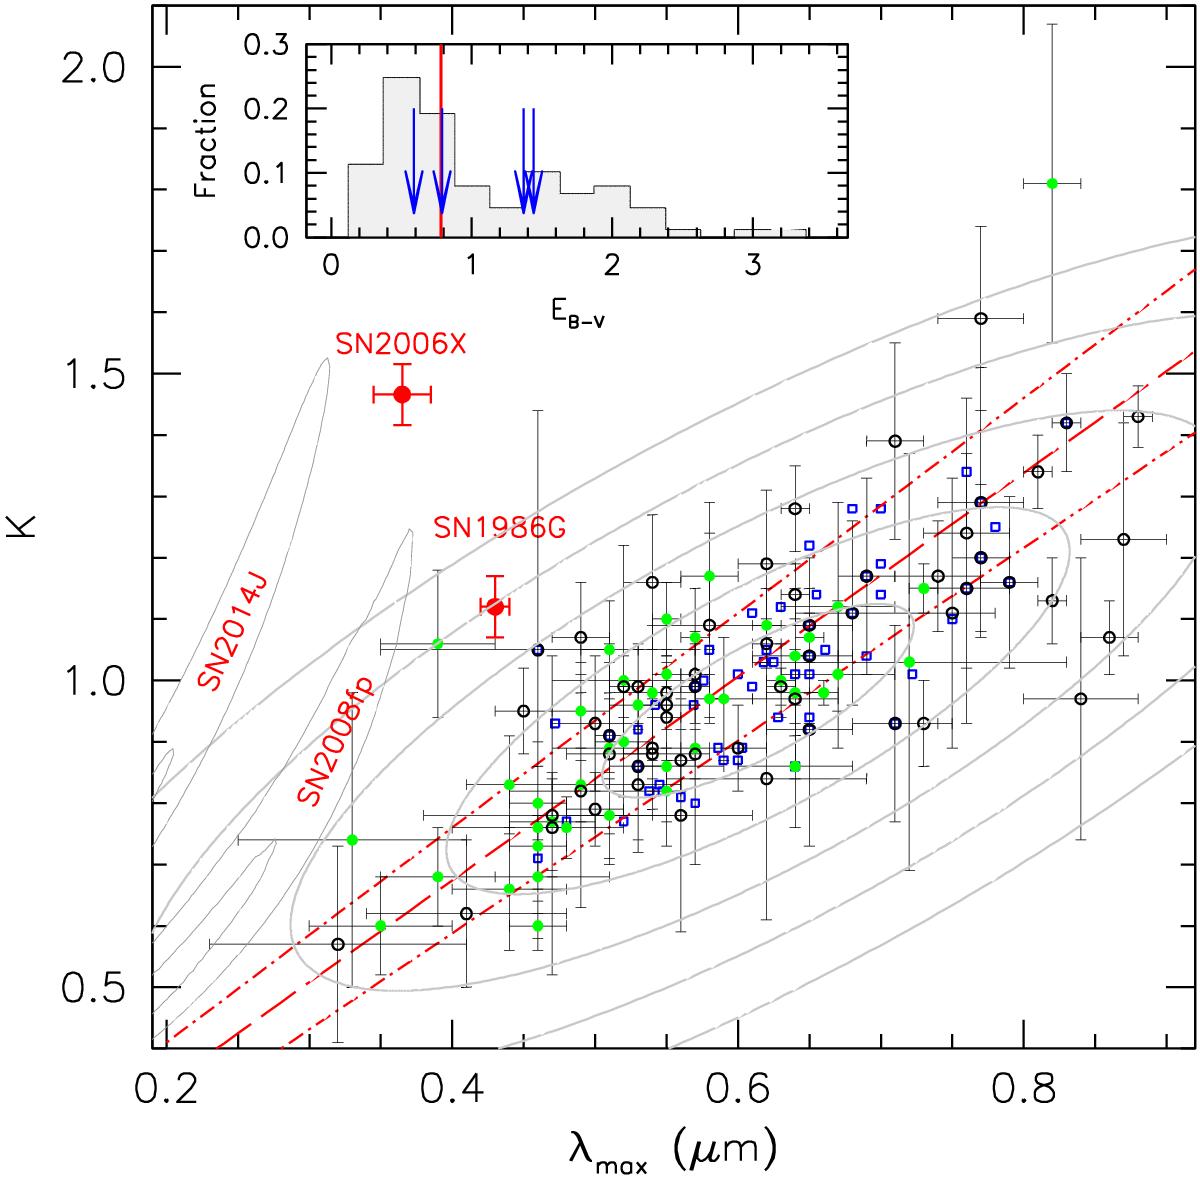
Serkowski parameters λmax and K for Galactic stars. The data are from Whittet et al. (1992, circles) and Voshchinnikov et al. (2013, squares). Filled symbols indicate objects with EB − V> 0.8. The ellipses trace the 1- to 5-sigma confidence levels for the full Whittet et al. sample (for a bi-variate Gaussian distribution). For comparison, the parameters derived for SN 1986G and 2006X are plotted (large filled circles). The long-dashed line traces the Whittet et al. relation (the dashed-dotted lines indicate the ±1-sigma levels). The contours in the lower left corner of the plot indicate the 10- and 20-sigma confidence levels for SN 2008fp and 2014J. The upper left insert plots the EB − V distribution of the Whittet et al. (1992) sample of 105 stars. The vertical line marks the median value of EB − V, while the arrows indicate the values of the four SN (see Table 1).
Current usage metrics show cumulative count of Article Views (full-text article views including HTML views, PDF and ePub downloads, according to the available data) and Abstracts Views on Vision4Press platform.
Data correspond to usage on the plateform after 2015. The current usage metrics is available 48-96 hours after online publication and is updated daily on week days.
Initial download of the metrics may take a while.