Fig. 2
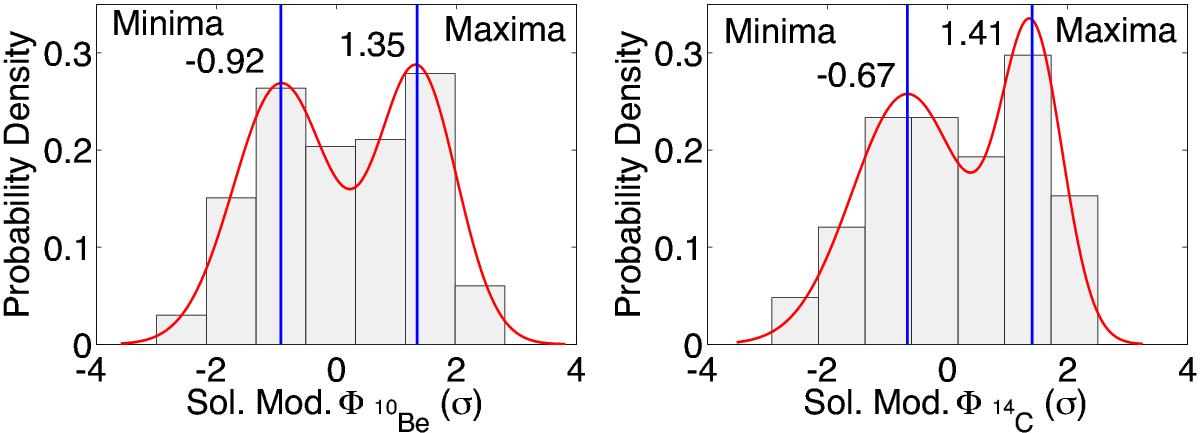
Left and right panels show histograms of all events recorded over the Holocene period, which overlap in solar modulation potential reconstructions based on the GRIP 10Be and the IntCal13 14C, respectively. The red line shows the bimodal Gaussian distribution fitted to the data, whereas the texts show the threshold values determined for identifying grand minima and maxima.
Current usage metrics show cumulative count of Article Views (full-text article views including HTML views, PDF and ePub downloads, according to the available data) and Abstracts Views on Vision4Press platform.
Data correspond to usage on the plateform after 2015. The current usage metrics is available 48-96 hours after online publication and is updated daily on week days.
Initial download of the metrics may take a while.