Fig. 5
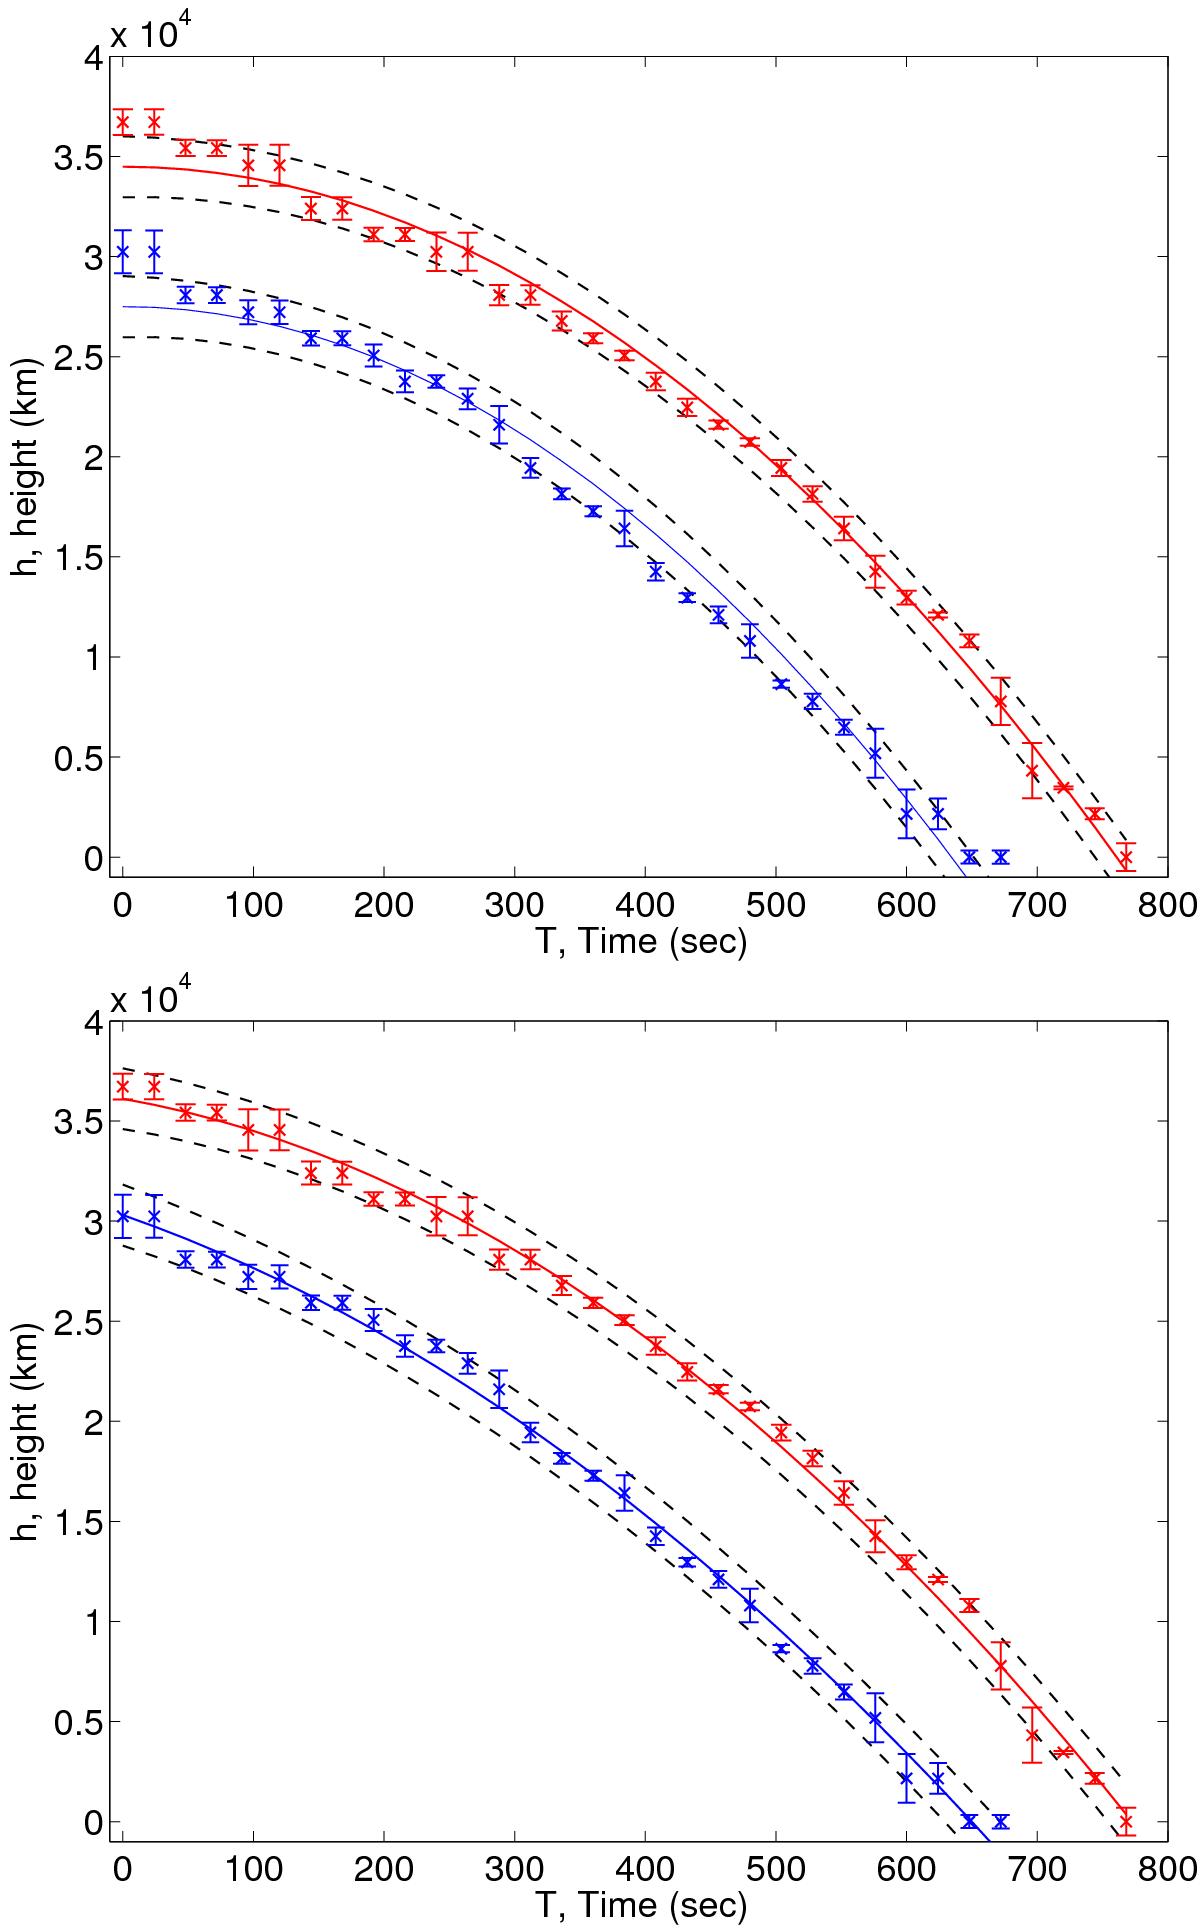
Height vs. time for the first (red dots) and the third (blue dots) blob from the first sequence. Fitted curves are the trajectories with constant acceleration for the first (red curve) and third (blue curve) blob. Upper panel: fitted trajectories with zero initial velocity. Lower panel: fitted trajectories with nonzero initial velocity. Error bars show the standard deviations, while the dashed curves show 95% confidence levels for the polynomial fitting.
Current usage metrics show cumulative count of Article Views (full-text article views including HTML views, PDF and ePub downloads, according to the available data) and Abstracts Views on Vision4Press platform.
Data correspond to usage on the plateform after 2015. The current usage metrics is available 48-96 hours after online publication and is updated daily on week days.
Initial download of the metrics may take a while.