Fig. 1
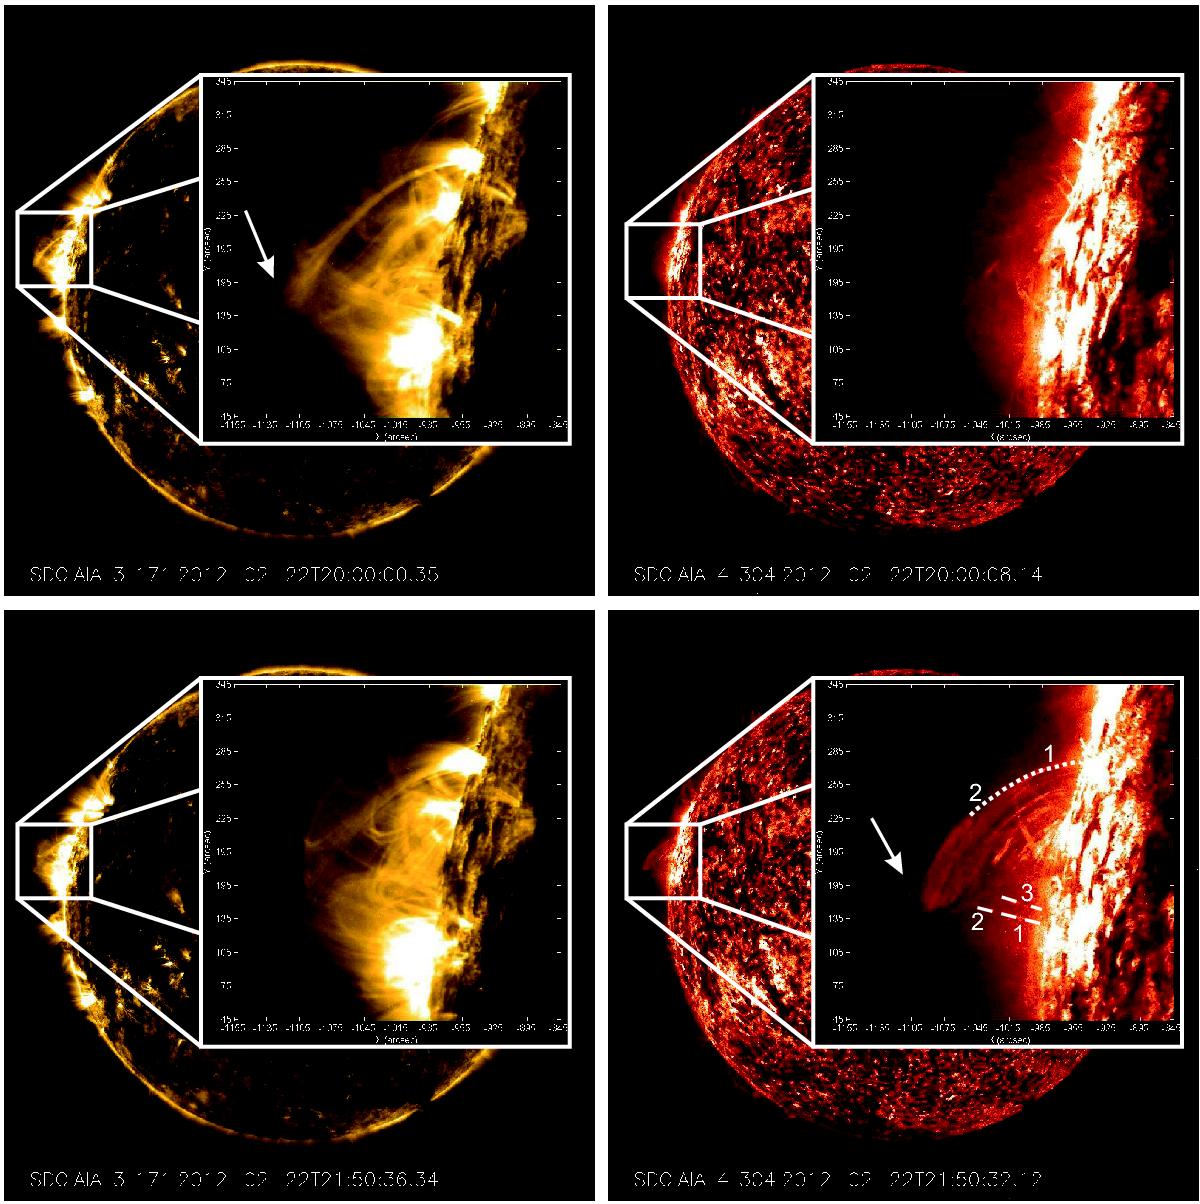
Cooling of a coronal loop as it is seen in coronal images above active region AR 11420 on February 22, 2012. Upper panels: images in the 171 Å (left) and 304 Å (right) lines at UT 20:00. Lower panels: images in the 171 Å (left) and 304 Å (right) lines after 2 h, i.e., at UT 21:50. The large boxes show zoom-ins of the active region corona. The dashed white lines in the lower right panel show the trajectories of the coronal rain blobs for event 1: the lower line corresponds to the trajectories of the first and second blob, while the upper line corresponds to the trajectory of the third blob. The dotted white line shows the trajectory of the coronal rain blobs for event 2: first and second blobs move on same path. The corresponding movies in the 171 Å and 304 Å lines are available online.
Current usage metrics show cumulative count of Article Views (full-text article views including HTML views, PDF and ePub downloads, according to the available data) and Abstracts Views on Vision4Press platform.
Data correspond to usage on the plateform after 2015. The current usage metrics is available 48-96 hours after online publication and is updated daily on week days.
Initial download of the metrics may take a while.