Fig. 7
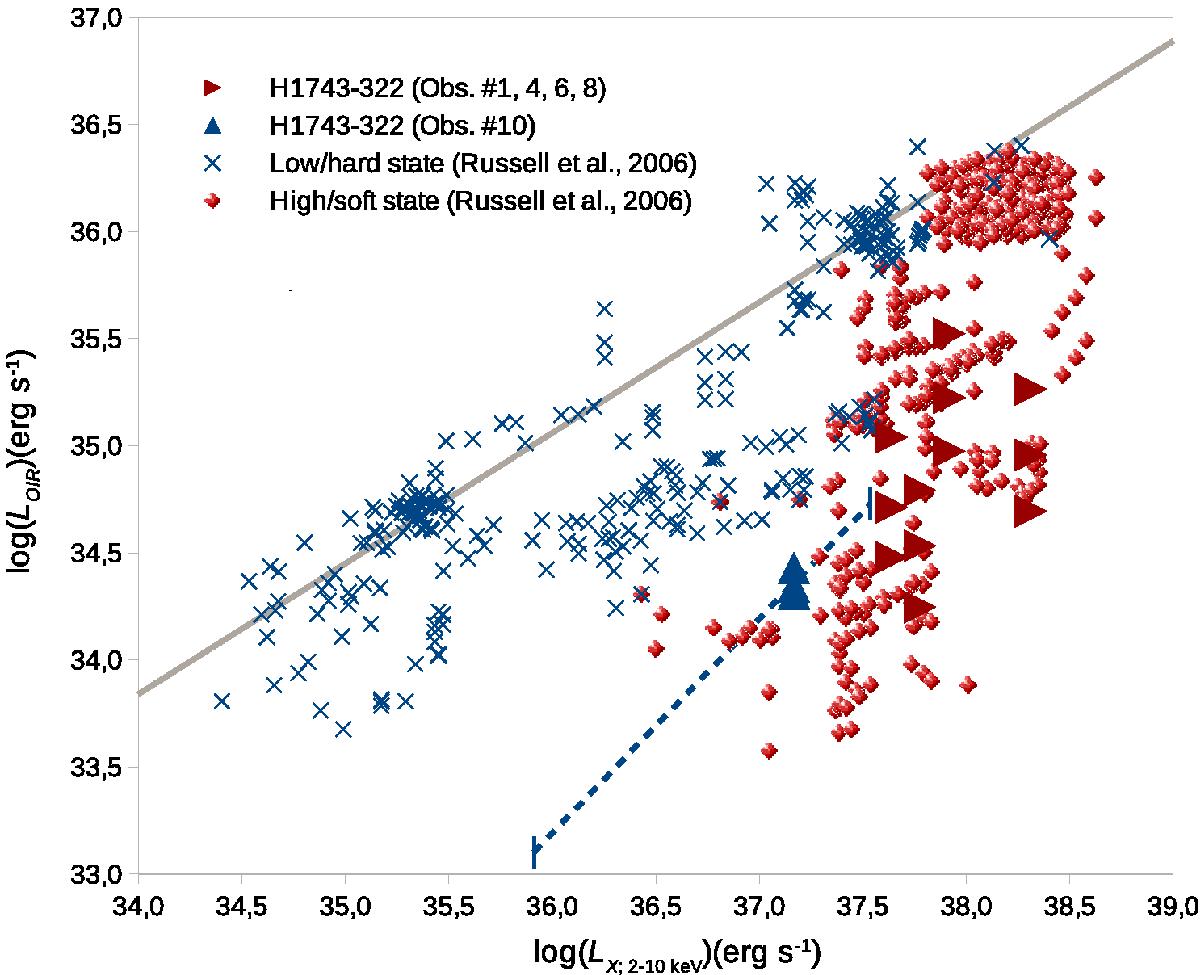
OIR vs. X-ray correlation for low-mass black-hole X-ray binaries in low, hard and high, soft states, with all data points taken from Russell et al. (2006). The central line represents the best power law fit for low, hard data points: ![]() . We added the J,H, and Ks data points of H 1743-322 reported in this paper (observations # 1, 4, 6, and 8 corresponding to HSS and observation #10 corresponding to LHS, respectively), computed at the distance of 8.5 kpc. The dashed line corresponds to the different positions of Obs. #10 (triangle) in LHS, computed for distances between 2 and 13 kpc. We see that while HSS data points of H 1743-322 are consistent with HSS data points of other sources, LHS data points of H 1743-322 are clearly located below the LHS data points of other sources, precisely between LHS and HSS data points of other sources.
. We added the J,H, and Ks data points of H 1743-322 reported in this paper (observations # 1, 4, 6, and 8 corresponding to HSS and observation #10 corresponding to LHS, respectively), computed at the distance of 8.5 kpc. The dashed line corresponds to the different positions of Obs. #10 (triangle) in LHS, computed for distances between 2 and 13 kpc. We see that while HSS data points of H 1743-322 are consistent with HSS data points of other sources, LHS data points of H 1743-322 are clearly located below the LHS data points of other sources, precisely between LHS and HSS data points of other sources.
Current usage metrics show cumulative count of Article Views (full-text article views including HTML views, PDF and ePub downloads, according to the available data) and Abstracts Views on Vision4Press platform.
Data correspond to usage on the plateform after 2015. The current usage metrics is available 48-96 hours after online publication and is updated daily on week days.
Initial download of the metrics may take a while.