Fig. 3
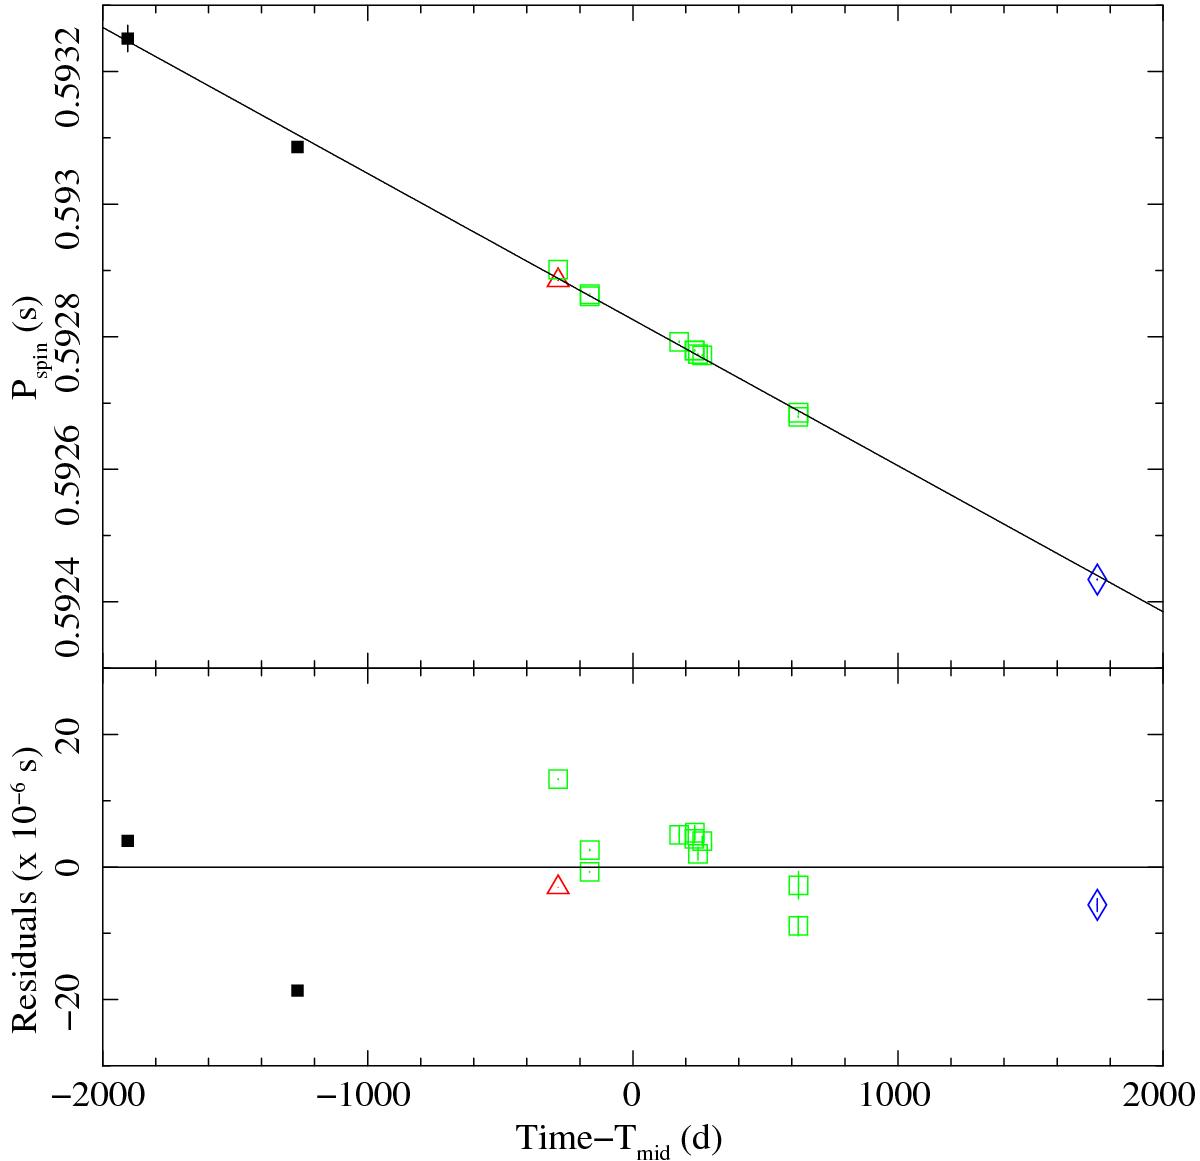
Top panel: spin period values shown in Table 1 vs. time in units of days (see the text). The linear best fit is also plotted. The black squares, open green squares, blue diamond, and red triangle indicate the spin period values reported by Jonker & van der Klis (2001), Jain et al. (2010), Sasano et al. (2014), and this work, respectively. Bottom panel: the corresponding residuals in units of 10-6 s.
Current usage metrics show cumulative count of Article Views (full-text article views including HTML views, PDF and ePub downloads, according to the available data) and Abstracts Views on Vision4Press platform.
Data correspond to usage on the plateform after 2015. The current usage metrics is available 48-96 hours after online publication and is updated daily on week days.
Initial download of the metrics may take a while.