Fig. 12
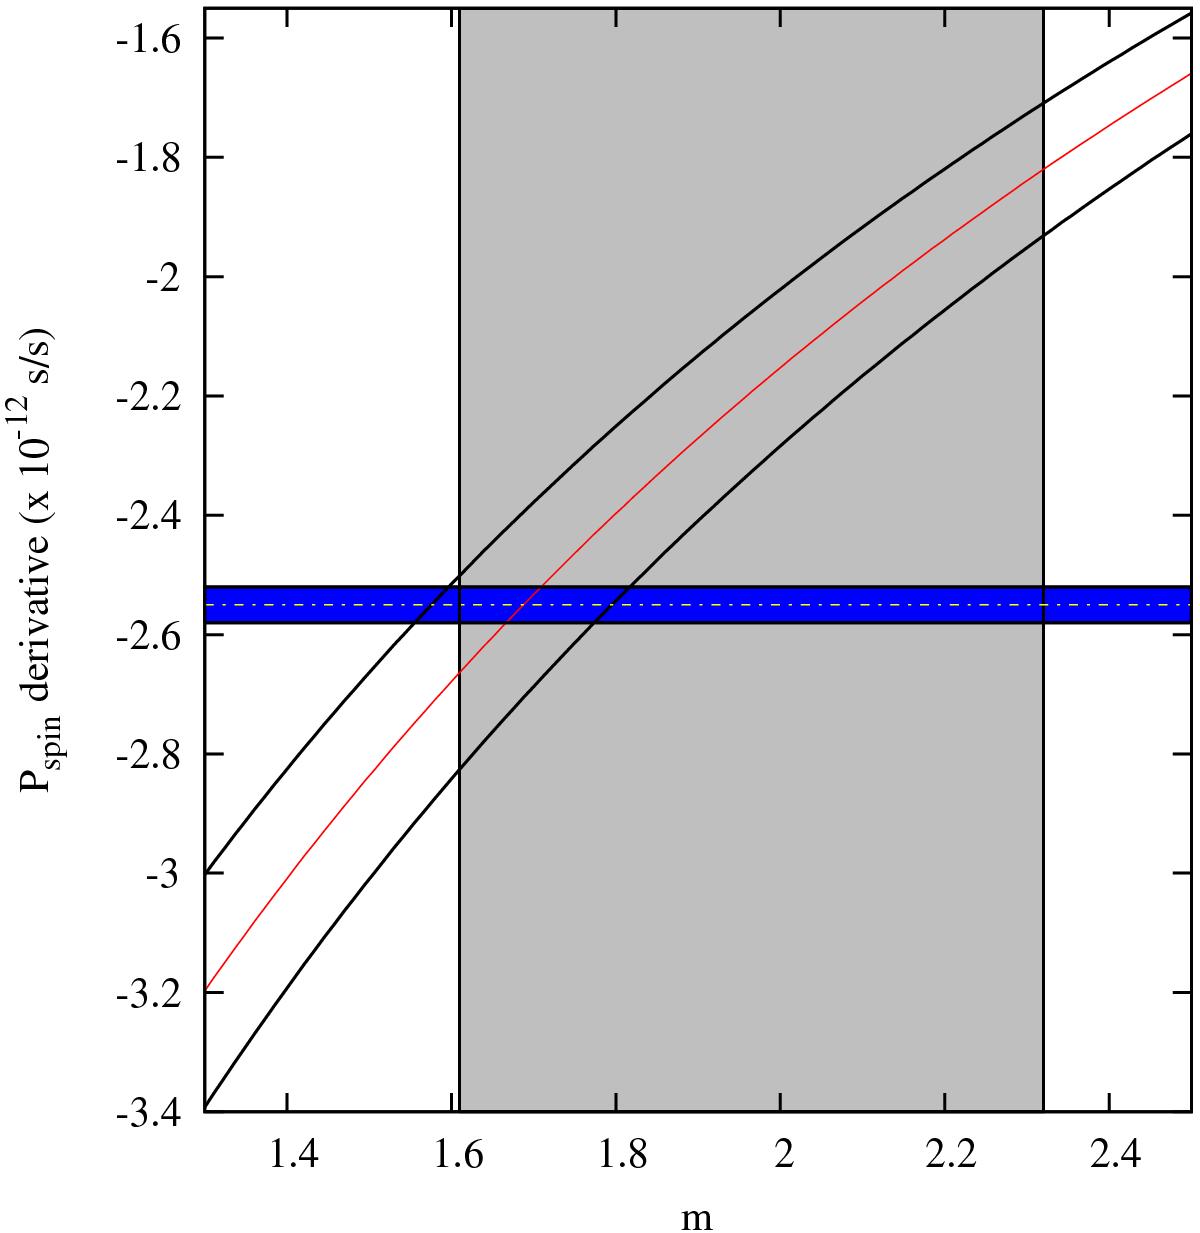
Spin period derivative, Ṗ-12, vs. m for a NS radius of 10 km (red curve); the black curves represent the upper and lower limit values of the spin derivative. The grey box indicates the mass range allowed for X1822-371 according to Muñoz-Darias et al. (2005). The horizontal blue strip indicates the value of Ṗ-12 as derived in Sect. 3.
Current usage metrics show cumulative count of Article Views (full-text article views including HTML views, PDF and ePub downloads, according to the available data) and Abstracts Views on Vision4Press platform.
Data correspond to usage on the plateform after 2015. The current usage metrics is available 48-96 hours after online publication and is updated daily on week days.
Initial download of the metrics may take a while.