Fig. 7
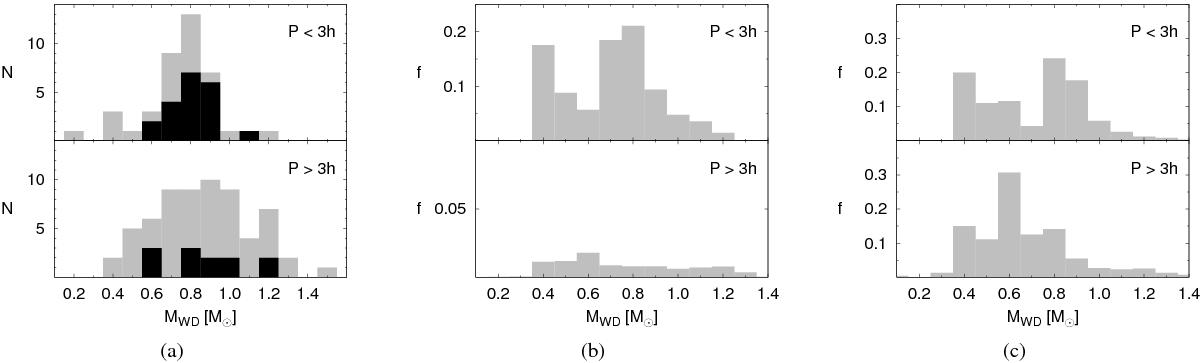
WD mass distribution used by Zorotovic et al. (2011; left) of our model with the Hachisu wind (middle) and of our model including 20 per cent mass growth of the WD during a nova cycle (right) separated into the distribution of CVs in or below the gap (top panels) and CVs above the gap (bottom panels). The black histograms in the left figure represent a sub-sample of which the mass determination is presumably more reliable. The fractions in the middle and right panel are normalized to the total formation probability of all CVs in our models. The observations show a dispersion of WD masses above the gap, while the WD masses below the gap are more concentrated around 0.8 M⊙. Both features can also be seen in the model that includes the Hachisu wind (middle), but not in the 20 per cent mass growth model (right).
Current usage metrics show cumulative count of Article Views (full-text article views including HTML views, PDF and ePub downloads, according to the available data) and Abstracts Views on Vision4Press platform.
Data correspond to usage on the plateform after 2015. The current usage metrics is available 48-96 hours after online publication and is updated daily on week days.
Initial download of the metrics may take a while.