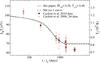
Fig. A.2
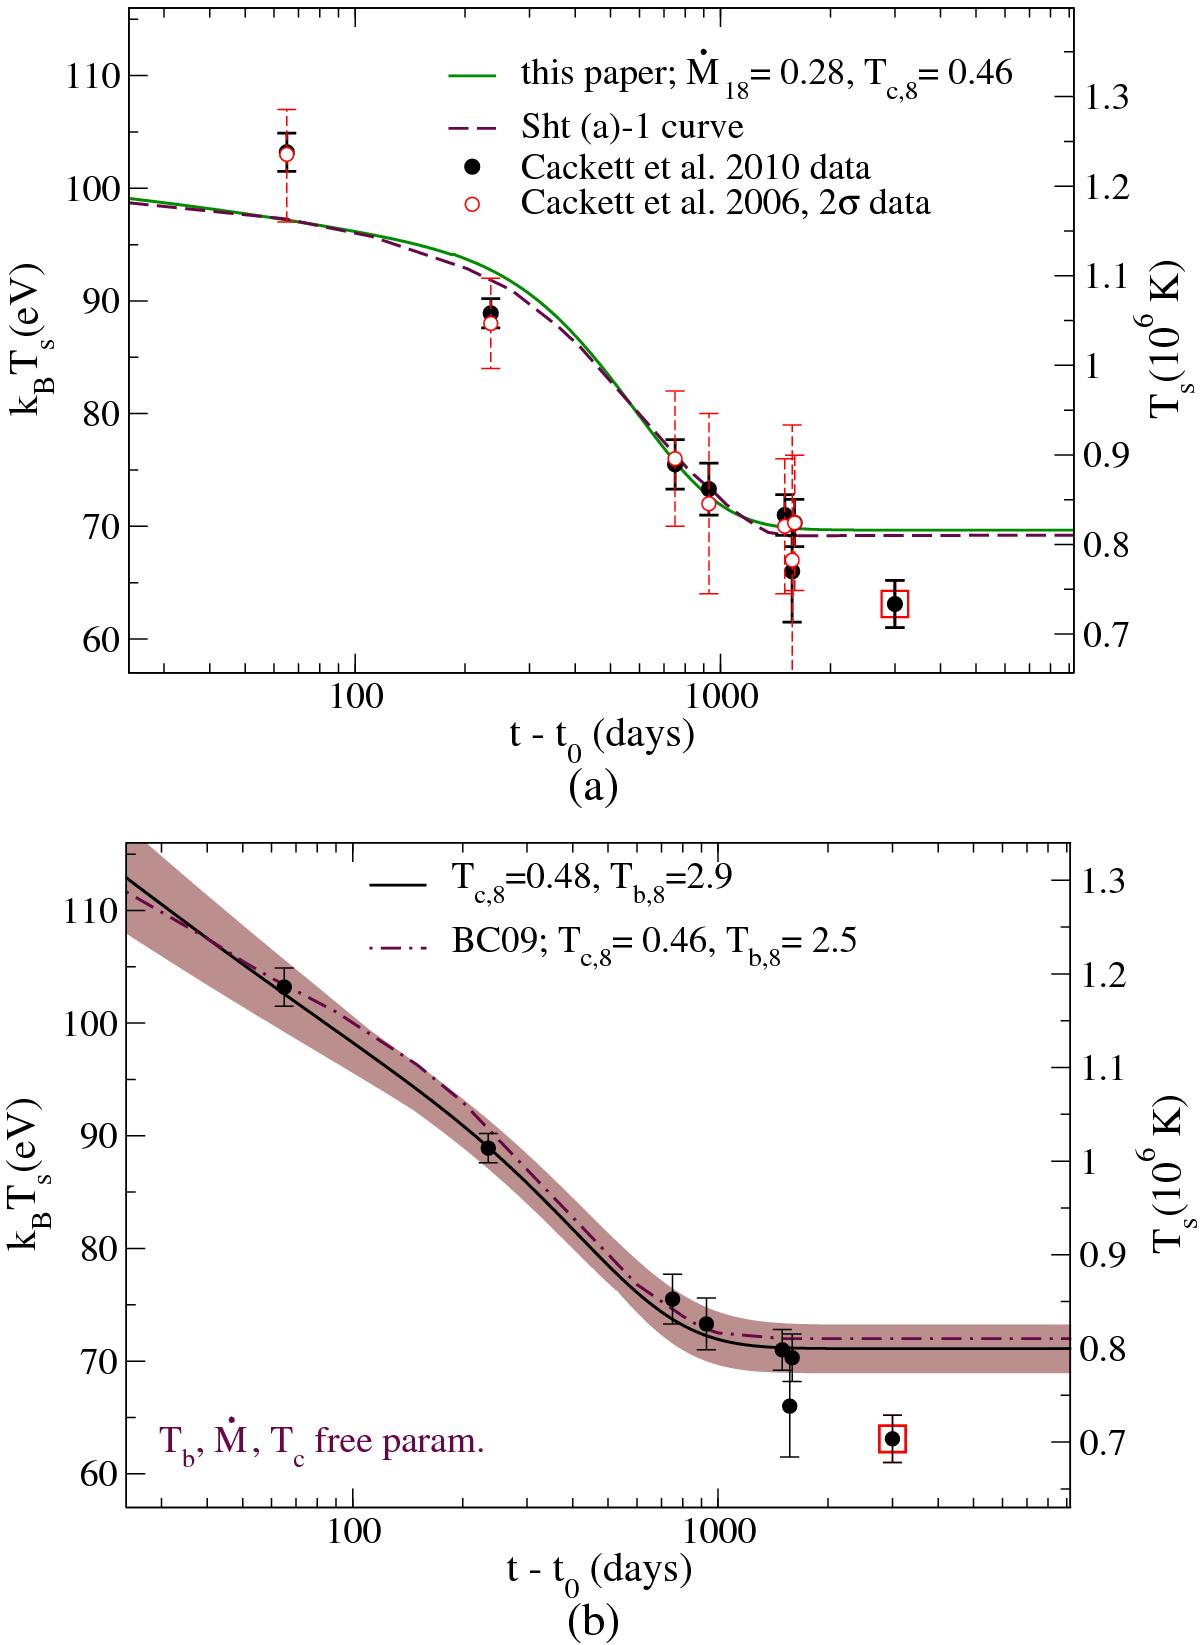
Comparison of our results for KS 1731−260 with Sht07 (upper panel) and BC09 (bottom panel). Solid curves are our fits and dashed and dotted dashed curves are Sht07 and BC09 results, respectively. M = 1.6 M⊙ is fixed for all. The last observation (with a red square) was reported after the publication of those works. a) The solid line is our curve with Qimp = 2. The dashed curve is from Sht07. b) The solid curve is our best fit with χ2 = 0.5. Fixed parameters are Ṁ18 = 0.1 and Qimp = 1.5. The brown region corresponds to χ2< 2 with free parameters varying in ranges Tc,8 = (0.45 − 0.51) and Tb,8 = (2.5 − 3.4).
Current usage metrics show cumulative count of Article Views (full-text article views including HTML views, PDF and ePub downloads, according to the available data) and Abstracts Views on Vision4Press platform.
Data correspond to usage on the plateform after 2015. The current usage metrics is available 48-96 hours after online publication and is updated daily on week days.
Initial download of the metrics may take a while.