Free Access
Fig. A.1
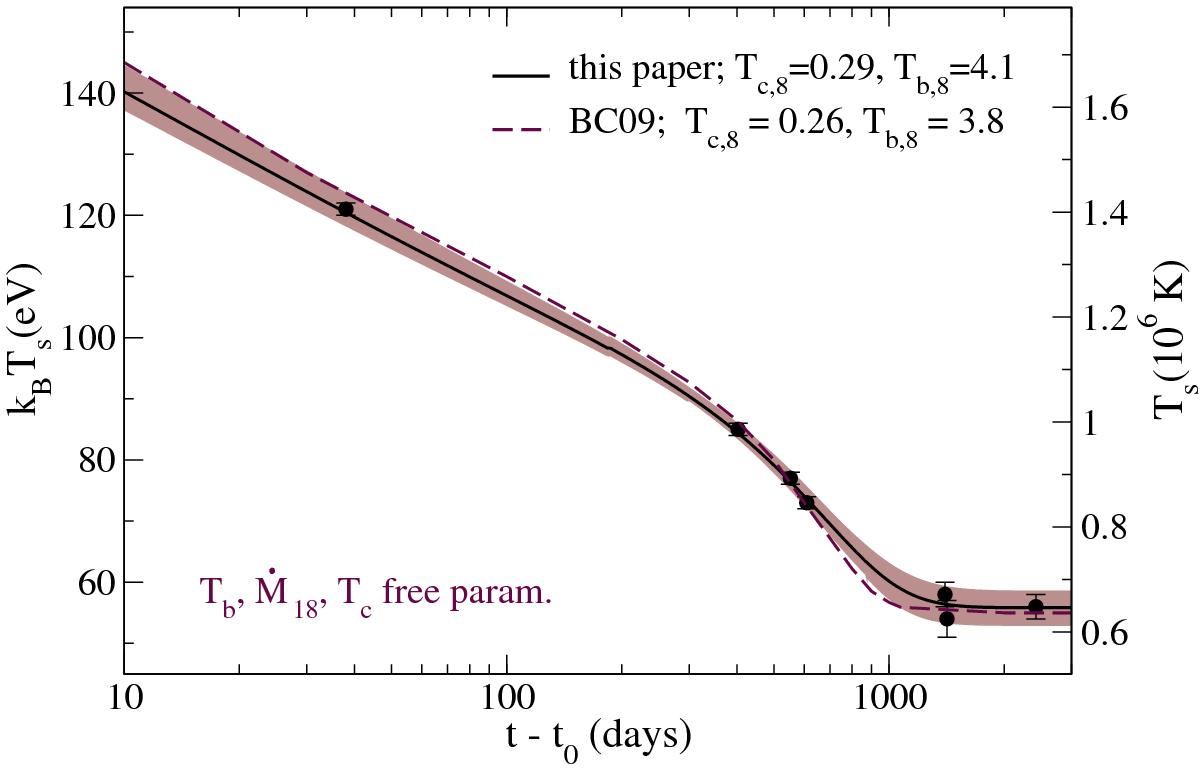
Comparison of our cooling curves for MXB 1659−29 with BC09. The solid line is our best fit with χ2 = 0.54, the dashed line is the result of BC09. The brown region is our curves with χ2< 2 corresponding to Tc,8 = 0.26 − 0.32 and Tb,8 = 3.9 − 4.4. For all curves Ṁ18 = 0.1 is fixed.
Current usage metrics show cumulative count of Article Views (full-text article views including HTML views, PDF and ePub downloads, according to the available data) and Abstracts Views on Vision4Press platform.
Data correspond to usage on the plateform after 2015. The current usage metrics is available 48-96 hours after online publication and is updated daily on week days.
Initial download of the metrics may take a while.