Fig. 20
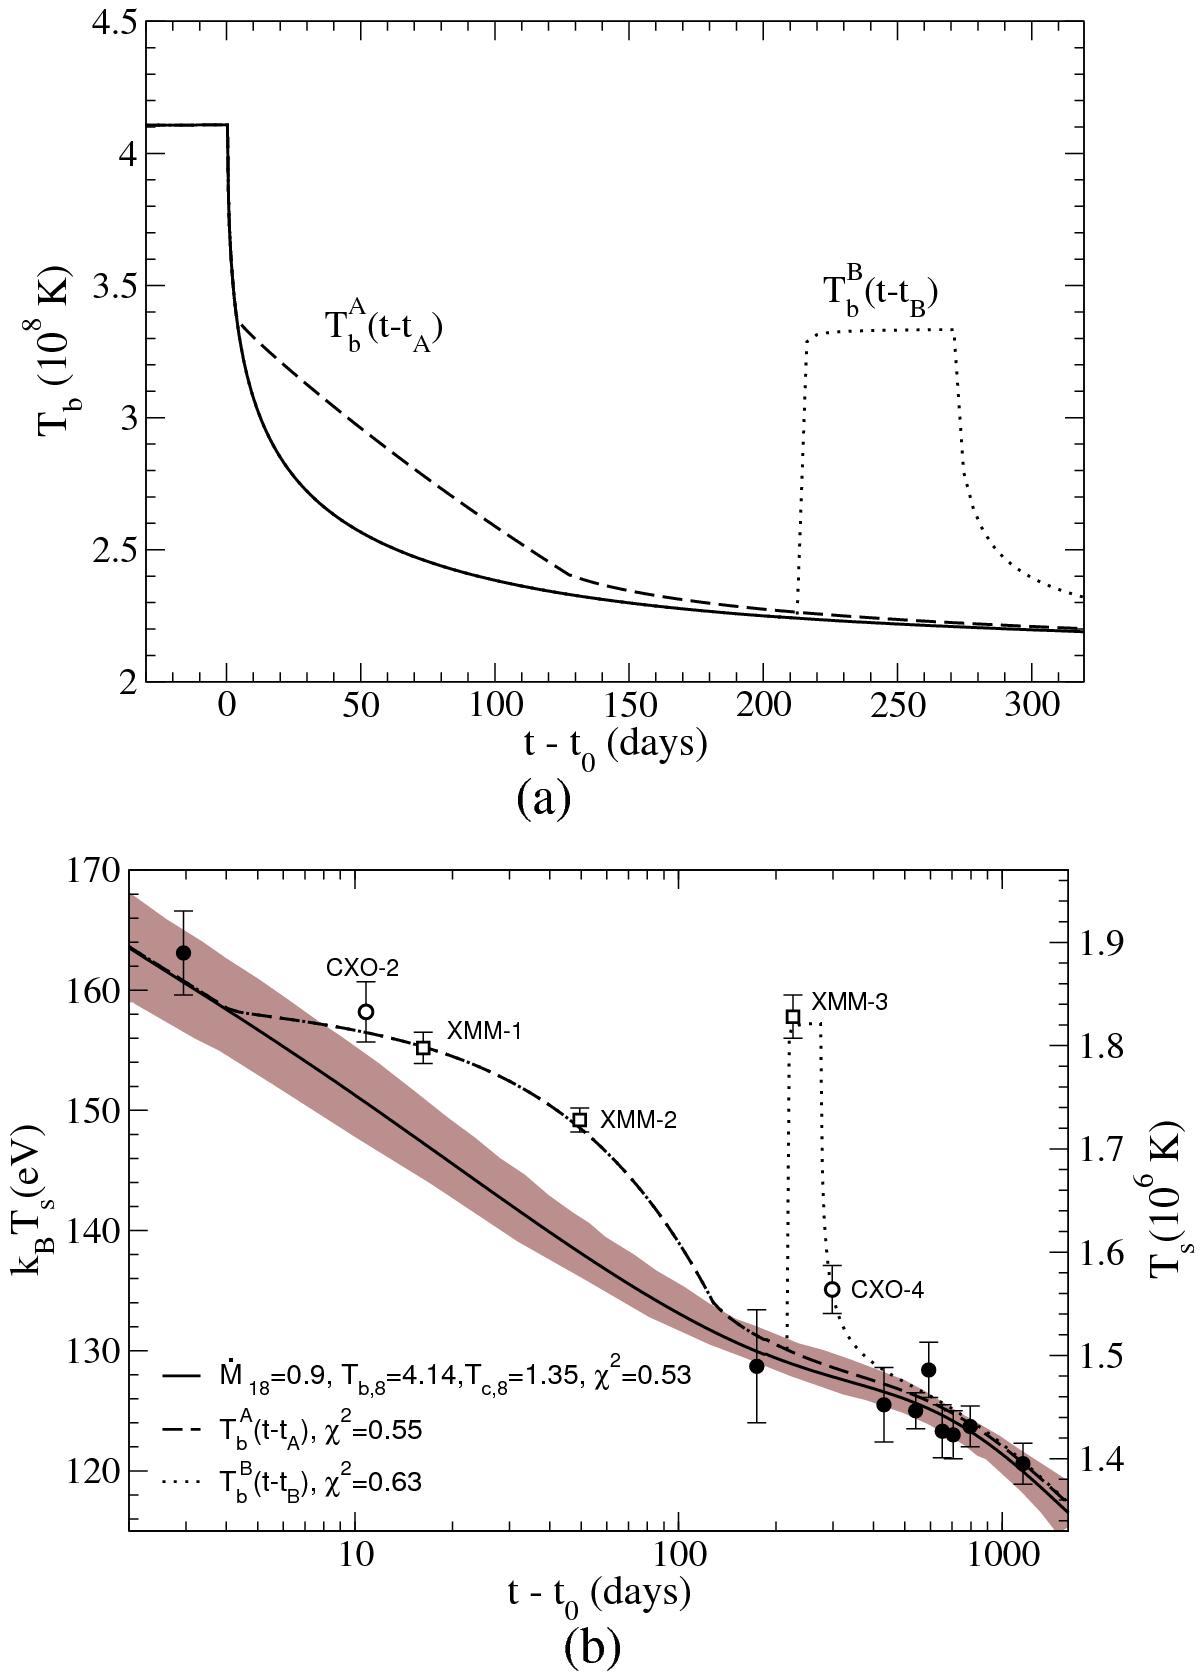
Residual accretion episodes during quiescence in XTE J1701−462. a) Evolution of Tb assumed during residual accretion episodes A and B (dashed and dotted lines, respectively). b) Cooling curves from fitting filled symbol data without residual accretion: solid line is the best fit with χ2 = 0.53 and brown band has χ2< 1 (with Ṁ18 = 0.7 − 1.3 and Tc,8 = 1.3 − 1.8). The dashed and dotted lines (χ2 = 0.55,0.63) include residual accretion through ![]() , respectively.
, respectively.
Current usage metrics show cumulative count of Article Views (full-text article views including HTML views, PDF and ePub downloads, according to the available data) and Abstracts Views on Vision4Press platform.
Data correspond to usage on the plateform after 2015. The current usage metrics is available 48-96 hours after online publication and is updated daily on week days.
Initial download of the metrics may take a while.