Free Access
Fig. 19
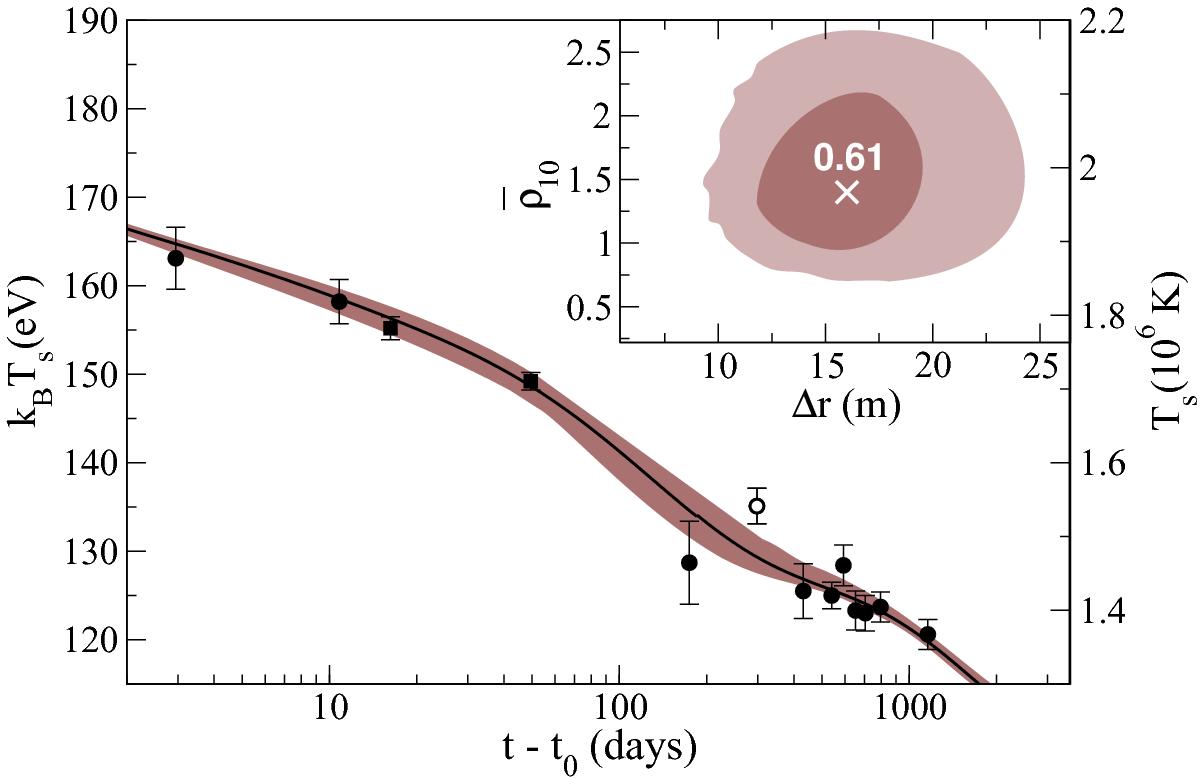
Cooling curves obtained by suppressing the electron thermal conductivity by Rsup = 0.1. The brown dark (light) regions correspond to χ2< 1( < 2), the solid line to χ2 = 0.61. We fix Tc,8 = 1.35 − 1.40, Ṁ = 1.1, Tb,8 = 4.05, Qimp = 1, and the Sch03 gap. The inset shows χ2< 2 contours in parameter space by varying Tc.
Current usage metrics show cumulative count of Article Views (full-text article views including HTML views, PDF and ePub downloads, according to the available data) and Abstracts Views on Vision4Press platform.
Data correspond to usage on the plateform after 2015. The current usage metrics is available 48-96 hours after online publication and is updated daily on week days.
Initial download of the metrics may take a while.