Free Access
Fig. 14
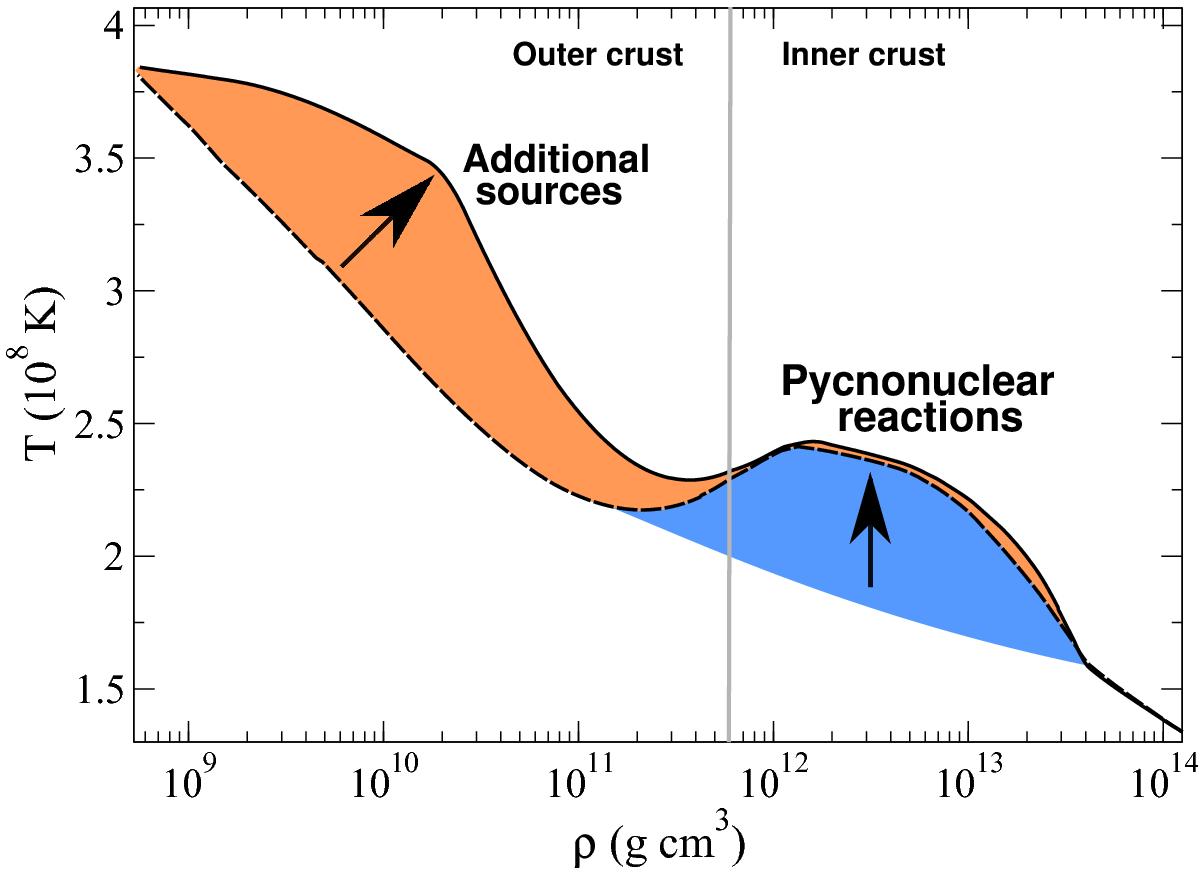
Heat sources that affect the initial thermal profile: pycnonuclear reactions as in HZ08 (dashed line) and additional sources in the outer crust (solid lines). The cooling curves for these thermal profiles fitting XTE J1701−462 data are shown in Fig. 15.
Current usage metrics show cumulative count of Article Views (full-text article views including HTML views, PDF and ePub downloads, according to the available data) and Abstracts Views on Vision4Press platform.
Data correspond to usage on the plateform after 2015. The current usage metrics is available 48-96 hours after online publication and is updated daily on week days.
Initial download of the metrics may take a while.