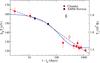
Fig. 1
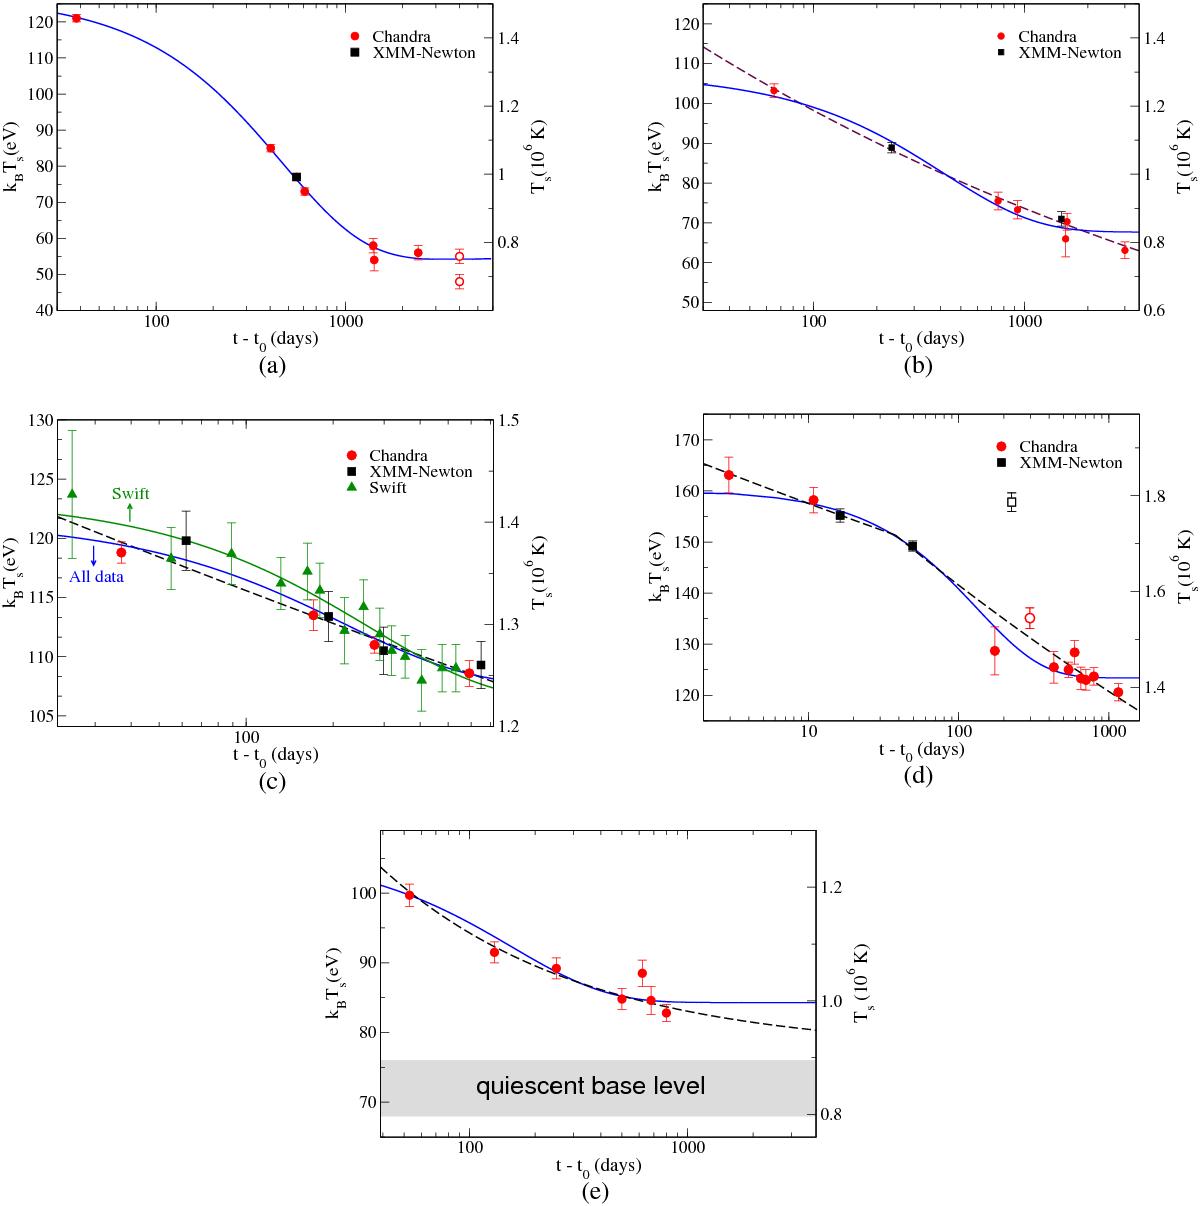
Observational data and corresponding fits taken from the literature. a) MXB 1659−29, data and fits from Cackett et al. (2008; 2013; open symbols). b) KS 1731−260, data and fits from Cackett et al. (2010a). c) EXO 0748−676, data and fits from Díaz Trigo et al. (2011) and Degenaar et al. (2011b). d) XTE J1701−462, data and fits from Fridriksson et al. (2011). Data with open symbols (XMM-3 and CXO-4) were not considered in fits. e) IGR J17480−2446, data and fits from Degenaar et al. (2013). Data from Chandra (circles), XMM-Newton (squares) and Swift (triangles) for all the sources. Exponential decay kBTs = a e− (t − t0) /τ + b (solid lines), and (broken) power-laws kBTs = α(t − t0)β (dashed lines) fits.
Current usage metrics show cumulative count of Article Views (full-text article views including HTML views, PDF and ePub downloads, according to the available data) and Abstracts Views on Vision4Press platform.
Data correspond to usage on the plateform after 2015. The current usage metrics is available 48-96 hours after online publication and is updated daily on week days.
Initial download of the metrics may take a while.