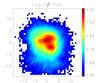
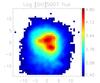
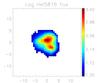
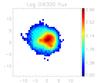
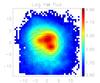
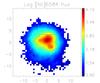
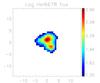
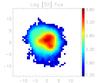
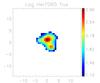
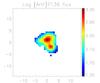
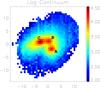
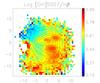
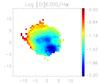
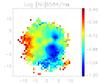
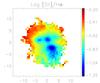
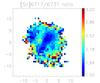
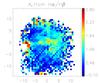
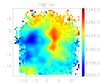
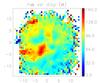
Fig. 6
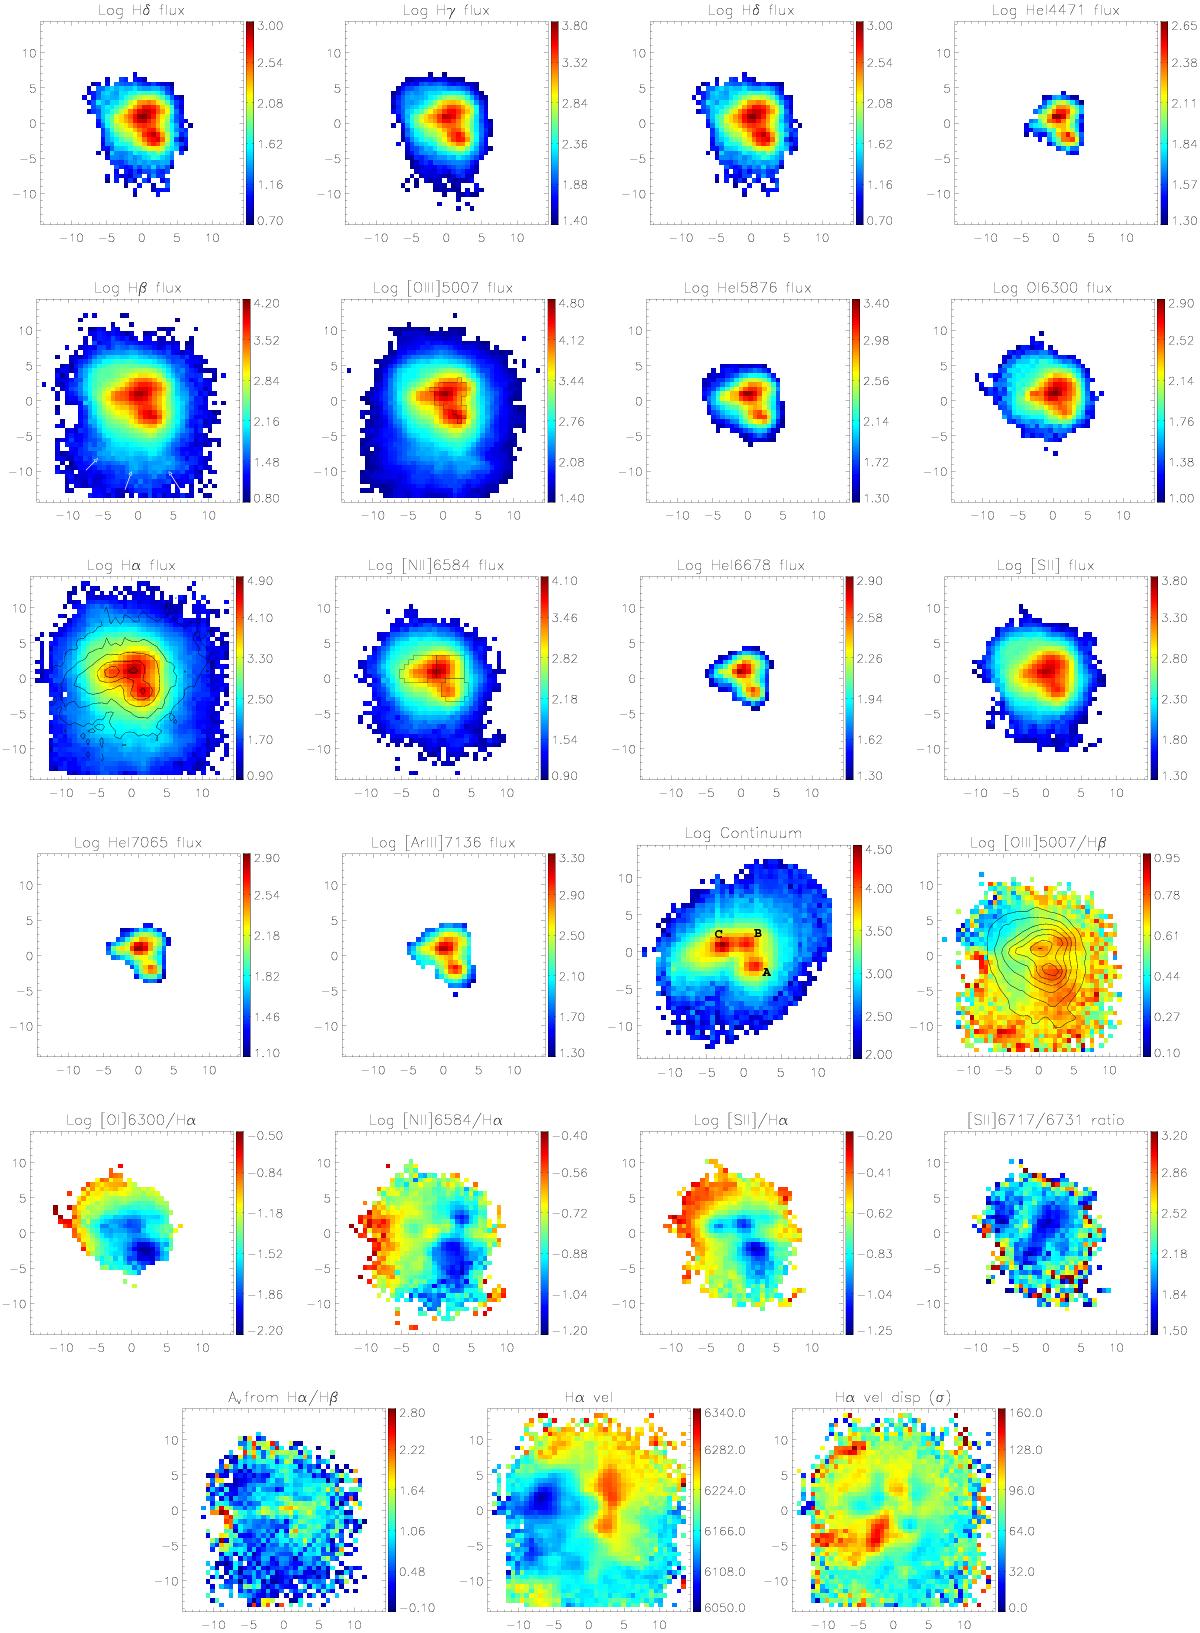
Emission-line fluxes, continuum, line ratios, and ionized gas kinematics maps for Haro 11. Knots are labeled in the continuum map following Kunth et al. (2003). Spaxels where the WR bump has been detected are outlined in the [O iii] λ5007 map. Continuum contours are overlaid on the Hα map; [O iii] λ5007 contours are overlaid on the [O iii] λ5007/Hβ map (in both maps contours are spaced 0.4 dex apart).The regions inside which spaxels were summed to obtain the integrated spectrum of the SF knots are outlined in the [N ii] λ6584 map. The arrows show the location of the filaments mentioned in the text (Sect. 4.1). The angular scale is 407 pc arcsec-1. North is up, east to the left. Axis units are arcseconds. Flux units are 10-18 erg s-1 cm-2 (per 0.67 × 0.67 arcsec2 spaxel). Velocity units are km s-1.

Current usage metrics show cumulative count of Article Views (full-text article views including HTML views, PDF and ePub downloads, according to the available data) and Abstracts Views on Vision4Press platform.
Data correspond to usage on the plateform after 2015. The current usage metrics is available 48-96 hours after online publication and is updated daily on week days.
Initial download of the metrics may take a while.