Free Access
Fig. 5
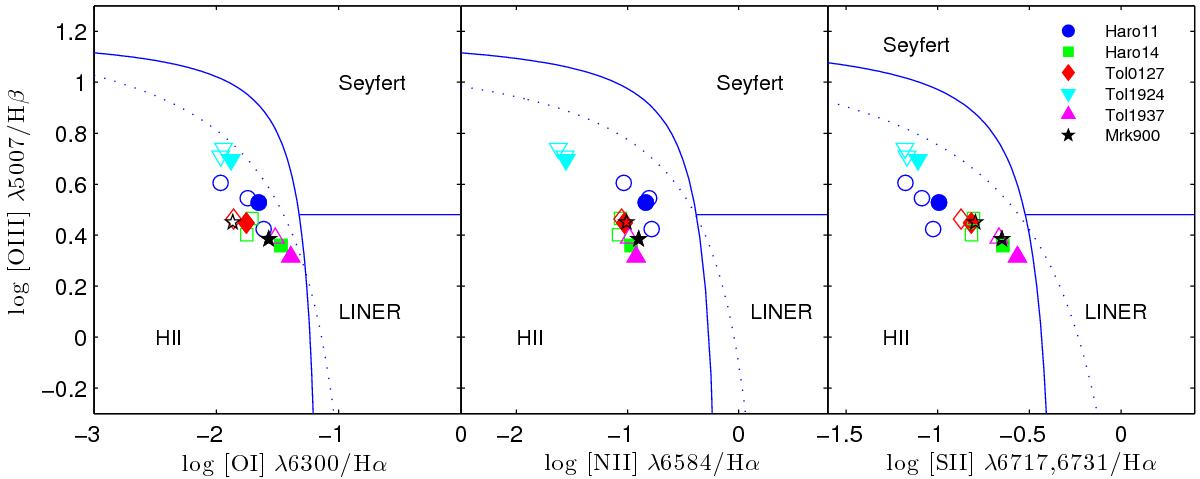
Optical emission-line diagnostic diagrams, separating Seyfert galaxies and LINERS from HII line objects. Integrated spectra are represented by filled symbols. Solid lines are the empirical borders from Veilleux & Osterbrock (1987), while dotted lines are the theoretical borders from Kewley et al. (2001).
Current usage metrics show cumulative count of Article Views (full-text article views including HTML views, PDF and ePub downloads, according to the available data) and Abstracts Views on Vision4Press platform.
Data correspond to usage on the plateform after 2015. The current usage metrics is available 48-96 hours after online publication and is updated daily on week days.
Initial download of the metrics may take a while.