Fig. 4
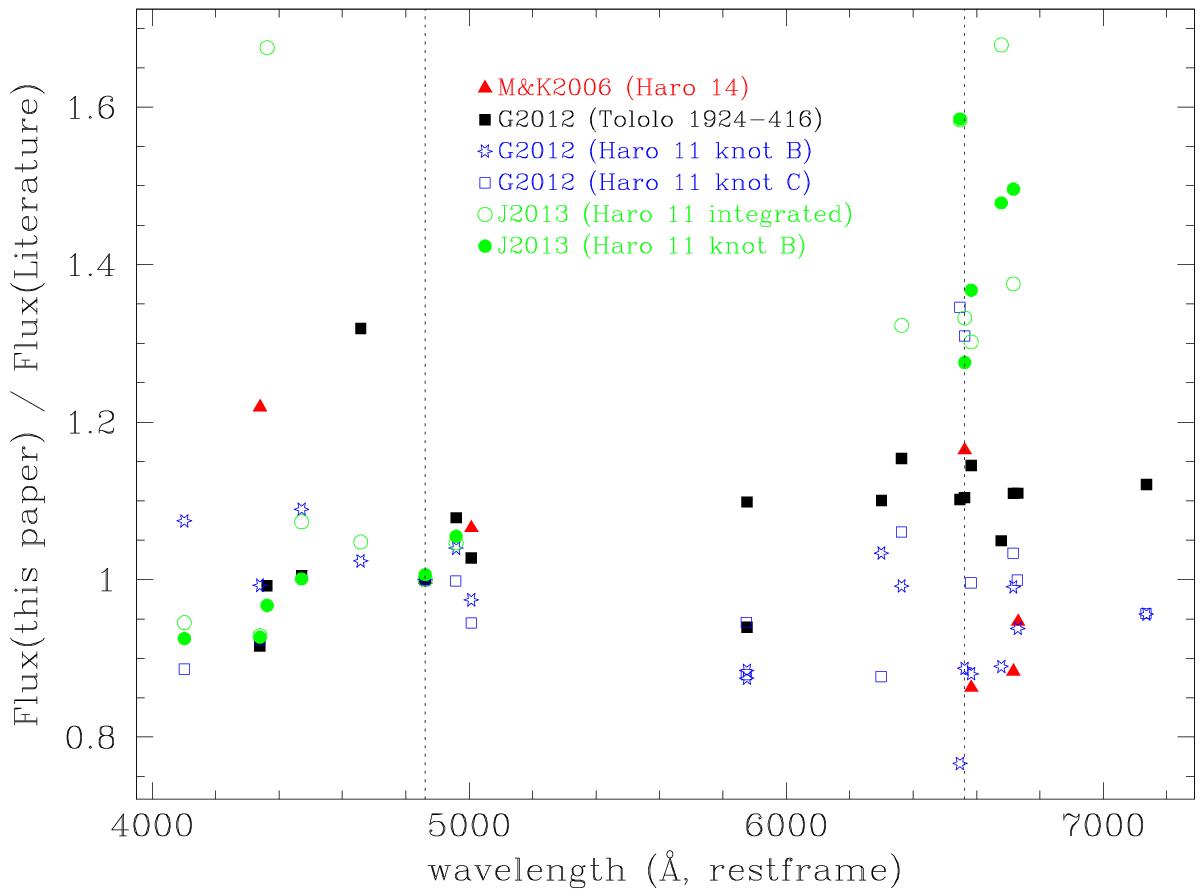
Ratio between the flux measured on our spectra with those published in the literature (all fluxes normalized to that of Hβ), plotted against the lines’ restframe wavelength. M&K2006: Moustakas & Kennicutt (2006); G2012: Guseva et al. (2012); J2013: James et al. (2013). The vertical dashed lines mark the location of the Hβ and Hα emission lines.
Current usage metrics show cumulative count of Article Views (full-text article views including HTML views, PDF and ePub downloads, according to the available data) and Abstracts Views on Vision4Press platform.
Data correspond to usage on the plateform after 2015. The current usage metrics is available 48-96 hours after online publication and is updated daily on week days.
Initial download of the metrics may take a while.