Fig. 3
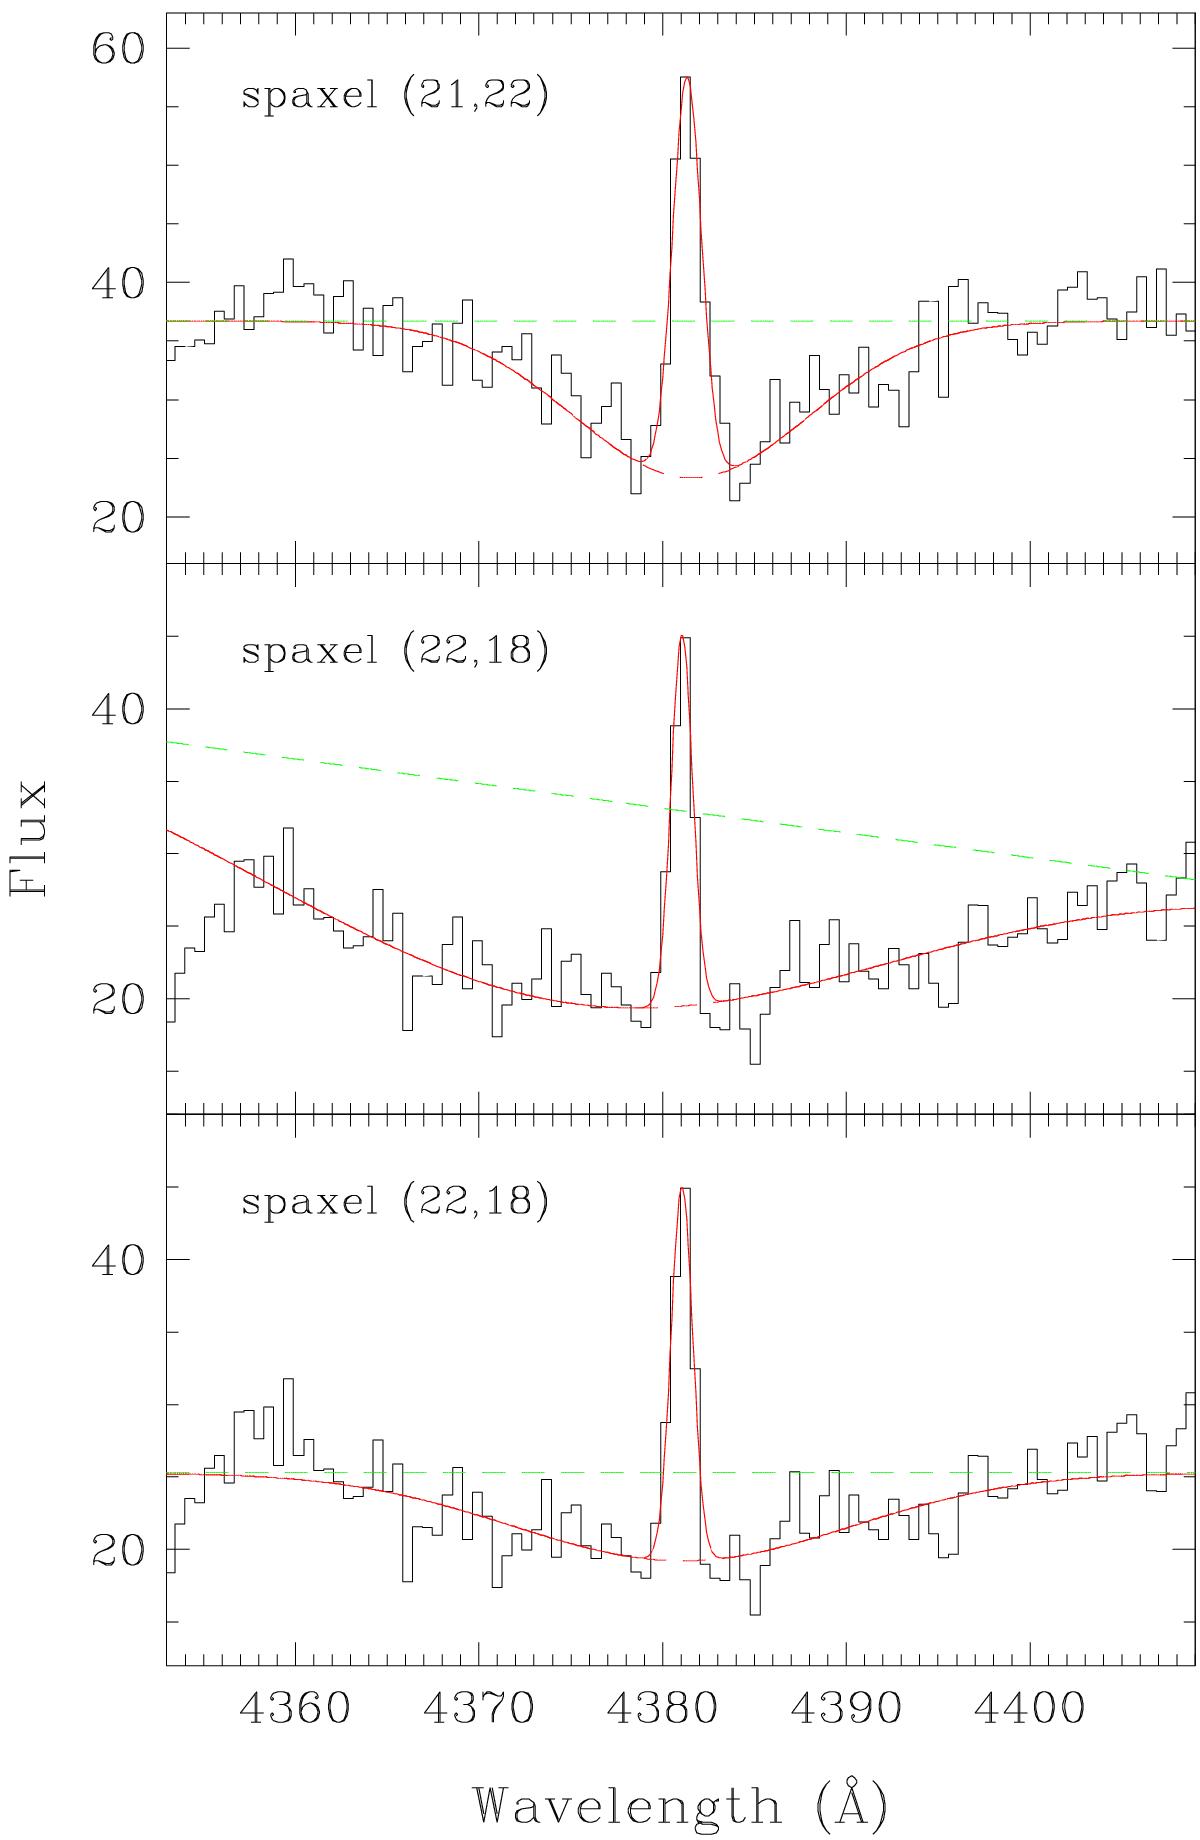
Comparison between the simultaneous fit to the absorption and emission components of the Hγ line for two spaxels in Tololo 1937-423. Upper panel: spectrum of spaxel (21, 22) around Hγ, together with the best fit (red solid line; the dashed green line represents the fitted continuum). Here the unconstrained fit provides a good match to the line profile. Central panel: unconstrained fit to spaxel (22, 18), which clearly fails to fit the continuum and overestimates the absorption component. Bottom panel: constrained fit, which is more physically sound, while yielding a slightly higher χ2 value.
Current usage metrics show cumulative count of Article Views (full-text article views including HTML views, PDF and ePub downloads, according to the available data) and Abstracts Views on Vision4Press platform.
Data correspond to usage on the plateform after 2015. The current usage metrics is available 48-96 hours after online publication and is updated daily on week days.
Initial download of the metrics may take a while.