Fig. 1
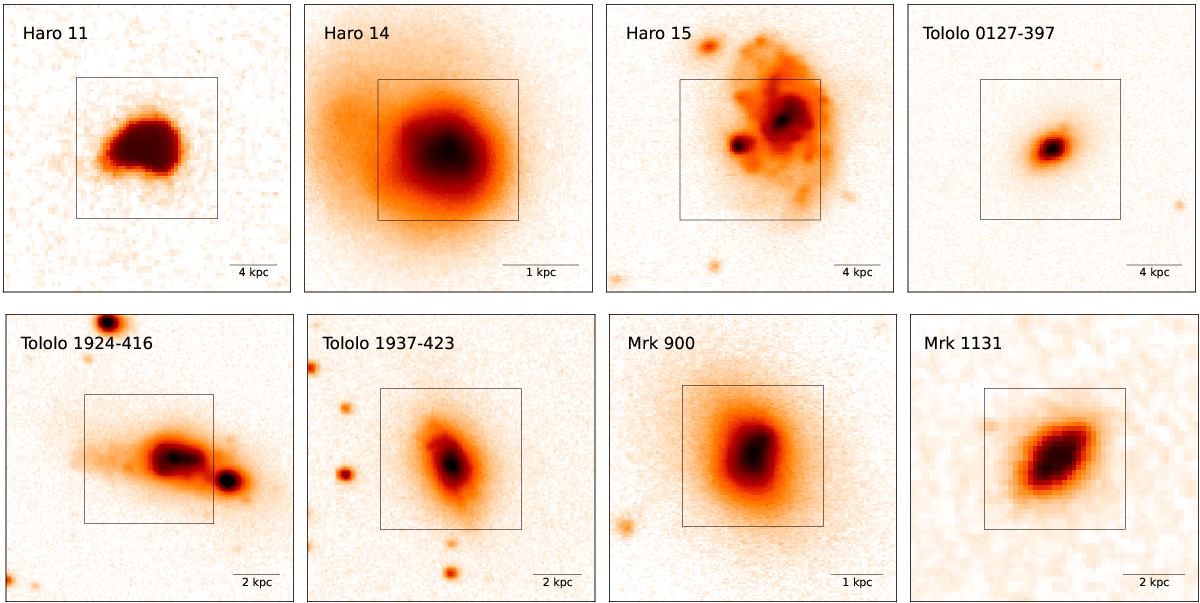
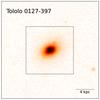
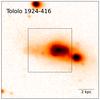
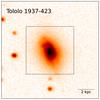
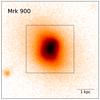
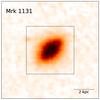
Broad-band images of the galaxies of the sample. The field of view is 1′ × 1′, while the inner box marks the ![]() area covered by the emission line maps presented in Figs. 6 to 13. All images are shown in logarithmic scale. North is up, east to the left. Haro 11: R-band, extracted from the image service of the Centre de Données astronomiques de Strasbourg (CDS) portal; Haro 14: B-band, 60-inch telescope on Mt. Palomar (Gil de Paz et al. 2003); Haro 15: B-Band, JKT 1.0 m (Cairós et al. 2001b); Tololo 0127-397: B-band, ESO Danish 1.54 m Telescope (Cairós et al. 2001b); Tololo 1924-416: B-band, du Pont 100 inch telescope in Las Campanas Observatory (Gil de Paz et al. 2003); Tololo 1937-423: B-band, du Pont 100 inch telescope in Las Campanas Observatory (Gil de Paz et al. 2003); Mrk 900: B-band, 60-inch telescope on Mt. Palomar (Gil de Paz et al. 2003); Mrk 1131: POSS-II frame extracted from the image service of the CDS portal.
area covered by the emission line maps presented in Figs. 6 to 13. All images are shown in logarithmic scale. North is up, east to the left. Haro 11: R-band, extracted from the image service of the Centre de Données astronomiques de Strasbourg (CDS) portal; Haro 14: B-band, 60-inch telescope on Mt. Palomar (Gil de Paz et al. 2003); Haro 15: B-Band, JKT 1.0 m (Cairós et al. 2001b); Tololo 0127-397: B-band, ESO Danish 1.54 m Telescope (Cairós et al. 2001b); Tololo 1924-416: B-band, du Pont 100 inch telescope in Las Campanas Observatory (Gil de Paz et al. 2003); Tololo 1937-423: B-band, du Pont 100 inch telescope in Las Campanas Observatory (Gil de Paz et al. 2003); Mrk 900: B-band, 60-inch telescope on Mt. Palomar (Gil de Paz et al. 2003); Mrk 1131: POSS-II frame extracted from the image service of the CDS portal.
Current usage metrics show cumulative count of Article Views (full-text article views including HTML views, PDF and ePub downloads, according to the available data) and Abstracts Views on Vision4Press platform.
Data correspond to usage on the plateform after 2015. The current usage metrics is available 48-96 hours after online publication and is updated daily on week days.
Initial download of the metrics may take a while.