Free Access
Fig. 3
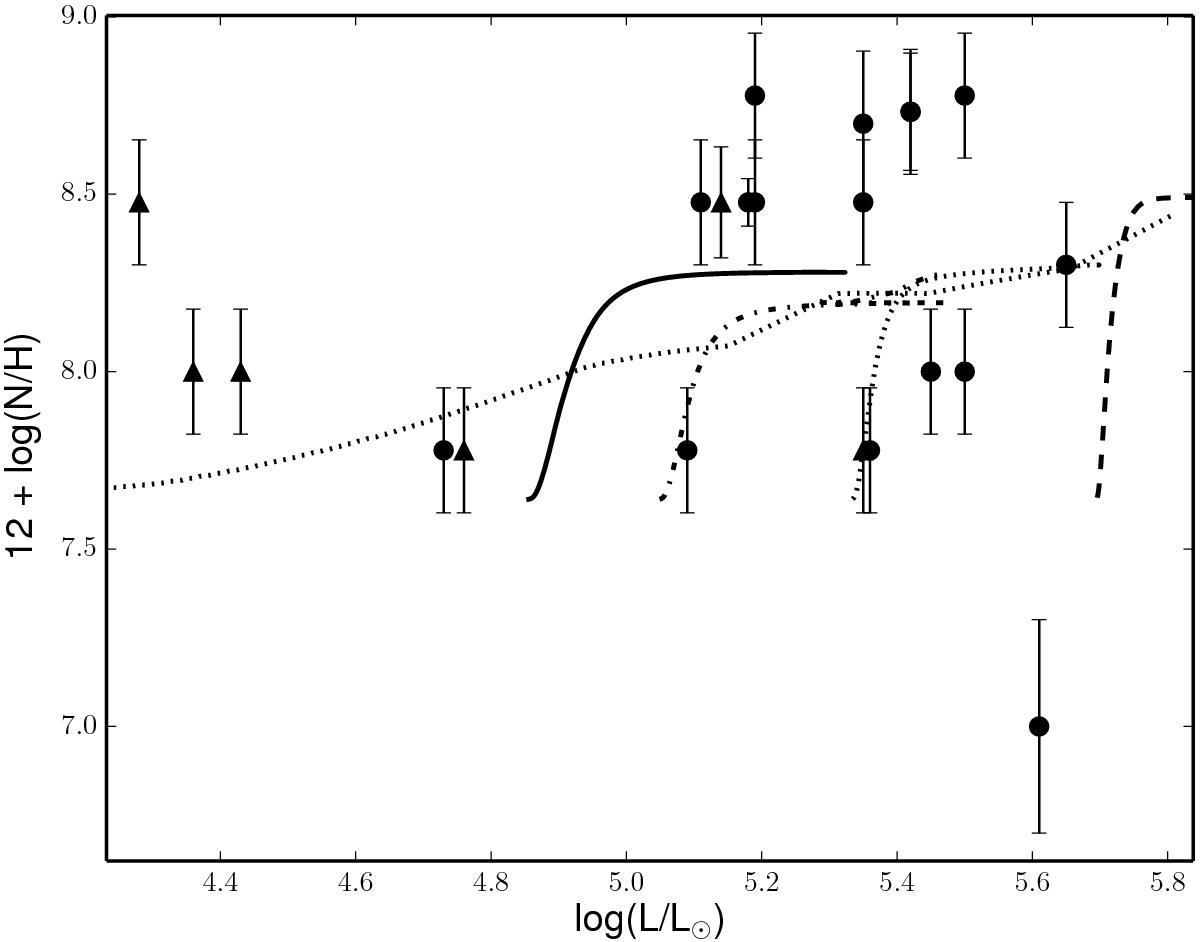
Nitrogen surface abundance (in units of 12 + log (N/H)) as a function of stellar luminosity. Dots represent the single O stars in our sample, whilst triangles are the binary components. Evolutionary tracks are (from left to right) computed for stars with 10, 15, 20, and 40 M⊙ and initial velocities of about 300 km s-1.
Current usage metrics show cumulative count of Article Views (full-text article views including HTML views, PDF and ePub downloads, according to the available data) and Abstracts Views on Vision4Press platform.
Data correspond to usage on the plateform after 2015. The current usage metrics is available 48-96 hours after online publication and is updated daily on week days.
Initial download of the metrics may take a while.