Fig. 2
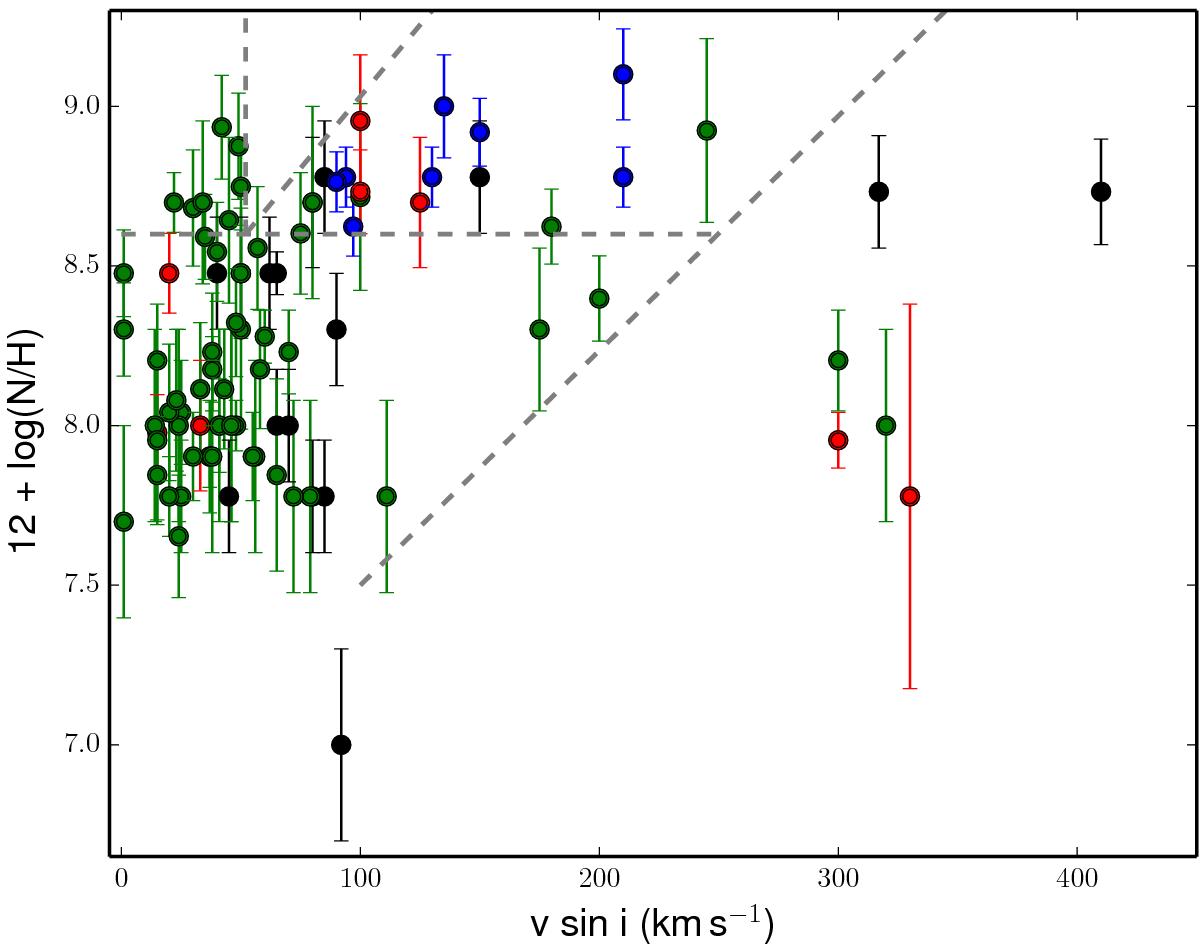
Nitrogen surface abundance (in units of 12 + log (N/H)) as a function of projected rotational velocity, the so-called Hunter diagram. O stars in our sample are shown in black, the O stars of NGC 2244 (Martins et al. 2012) in red, stars studied by Bouret et al. (2012) in blue, and the MiMes O-type stars (Martins et al. 2015) in green. Grey lines define the possible locations of the different groups.
Current usage metrics show cumulative count of Article Views (full-text article views including HTML views, PDF and ePub downloads, according to the available data) and Abstracts Views on Vision4Press platform.
Data correspond to usage on the plateform after 2015. The current usage metrics is available 48-96 hours after online publication and is updated daily on week days.
Initial download of the metrics may take a while.