Fig. 1
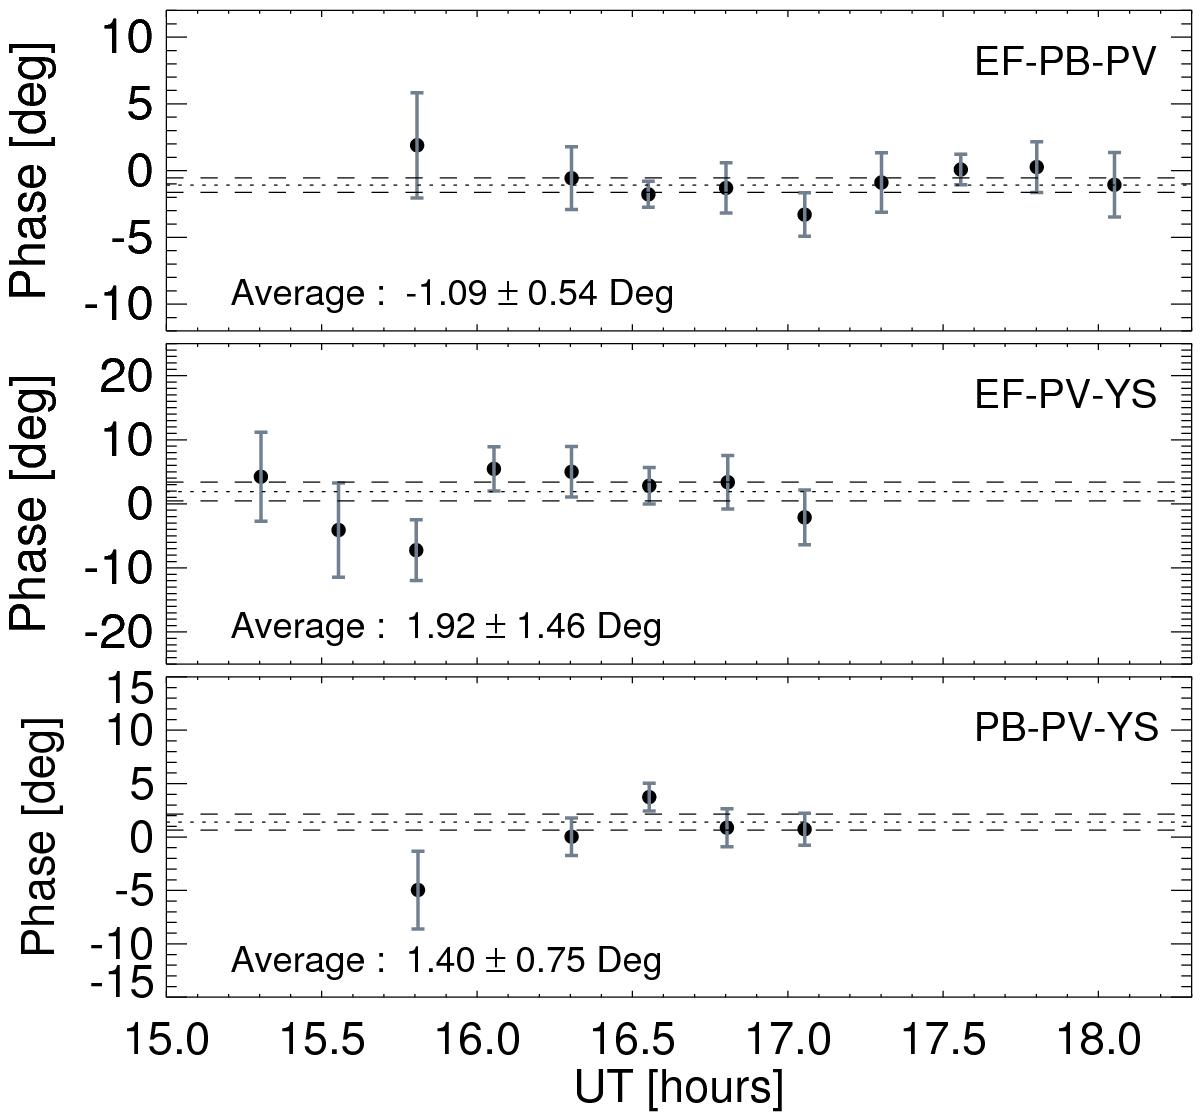
Closure phases vs. time for three independent VLBI triangles. Each data point denotes a closure phase measurement averaged over one scan of six minutes; error bars correspond to 1σ errors. Dotted lines indicate weighted averages of all data points, dashed lines represent the corresponding standard errors of mean. Average phase values are noted in each diagram. Phases for the triangle EF-PB-PV are extracted from Stokes I data, phases for the other triangles from LL data.
Current usage metrics show cumulative count of Article Views (full-text article views including HTML views, PDF and ePub downloads, according to the available data) and Abstracts Views on Vision4Press platform.
Data correspond to usage on the plateform after 2015. The current usage metrics is available 48-96 hours after online publication and is updated daily on week days.
Initial download of the metrics may take a while.