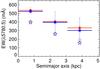
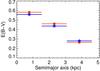
Fig. 3
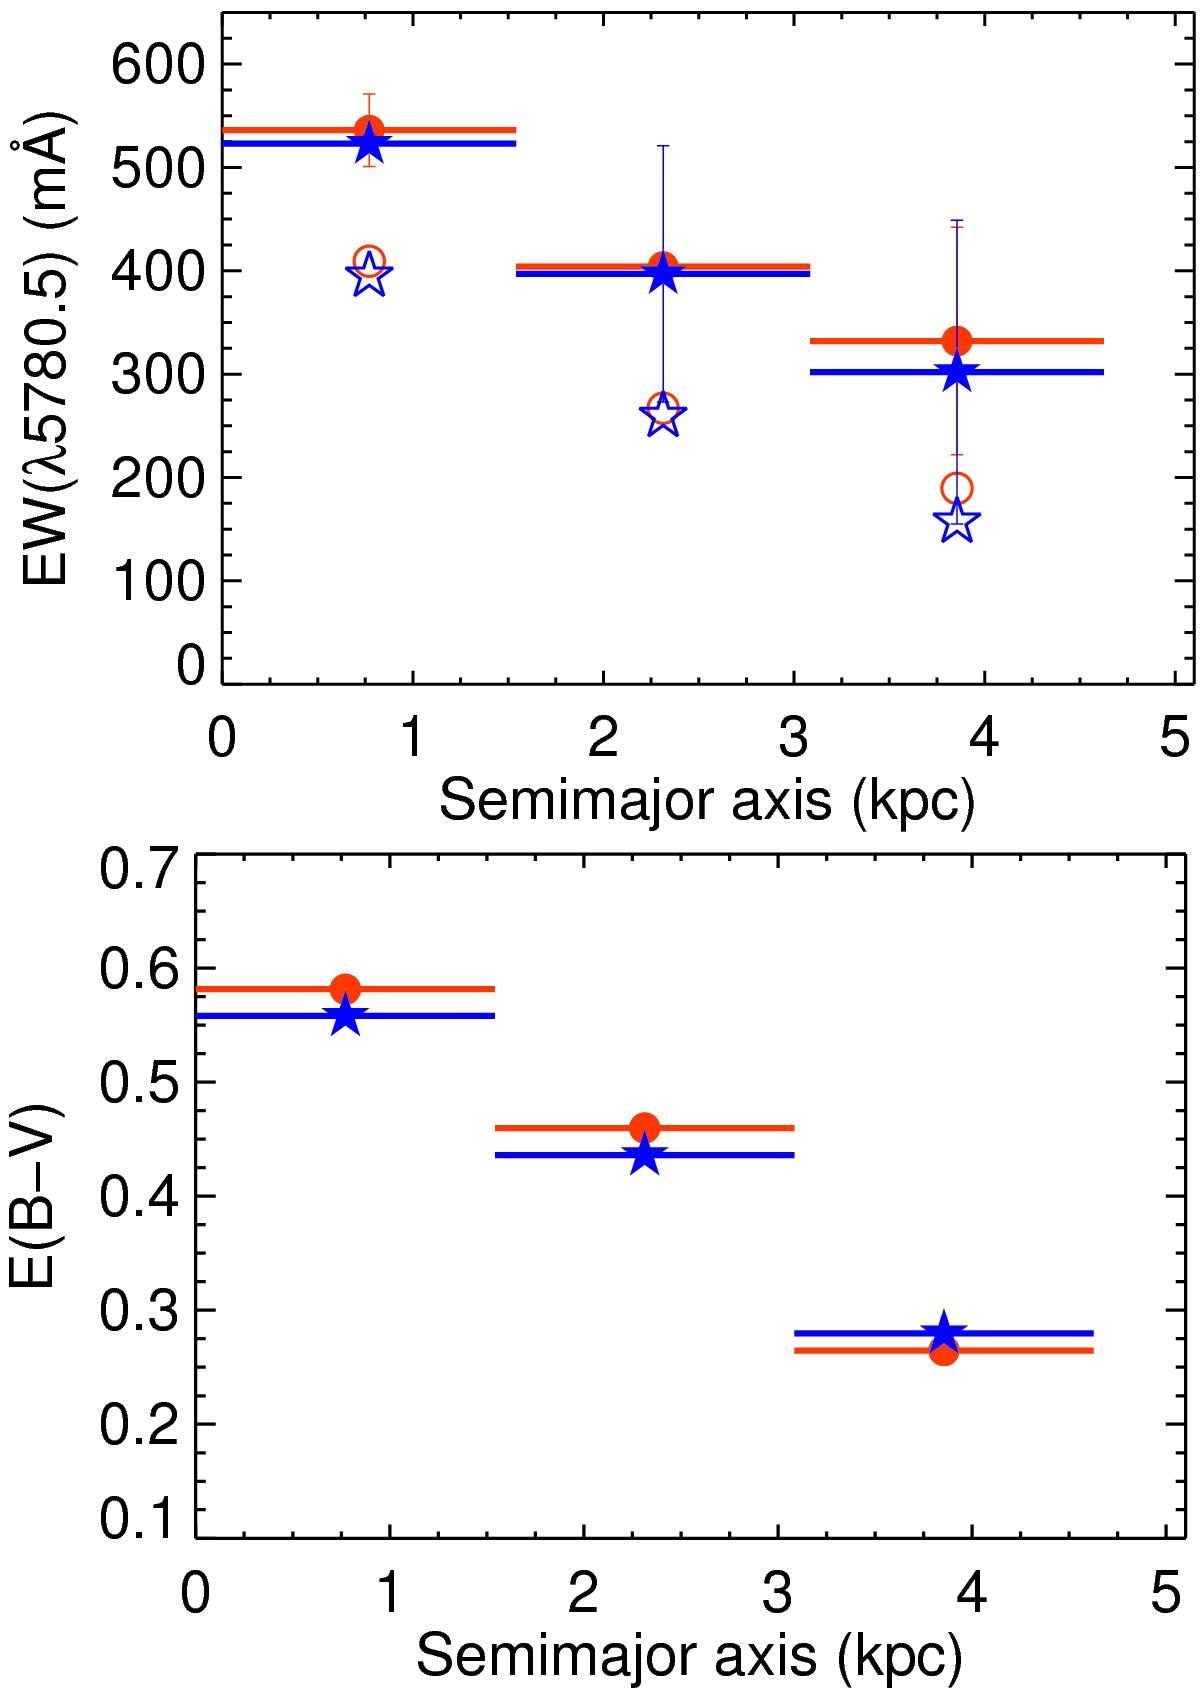
Radial profiles for EW(λ5780.5) (top) and the extinction (bottom) as derived from Hα/Hβ for the approaching (stars and blue lines) and receding (circles and red lines) sides. The horizontal bars traversing the filled symbols mark the radial extent over which the spectra were co-added. In the upper plot, filled symbols indicate measurements without correction, while open symbols include the maximum correction for the contamination of the stellar feature at λ5782 Å.
Current usage metrics show cumulative count of Article Views (full-text article views including HTML views, PDF and ePub downloads, according to the available data) and Abstracts Views on Vision4Press platform.
Data correspond to usage on the plateform after 2015. The current usage metrics is available 48-96 hours after online publication and is updated daily on week days.
Initial download of the metrics may take a while.