Fig. 2
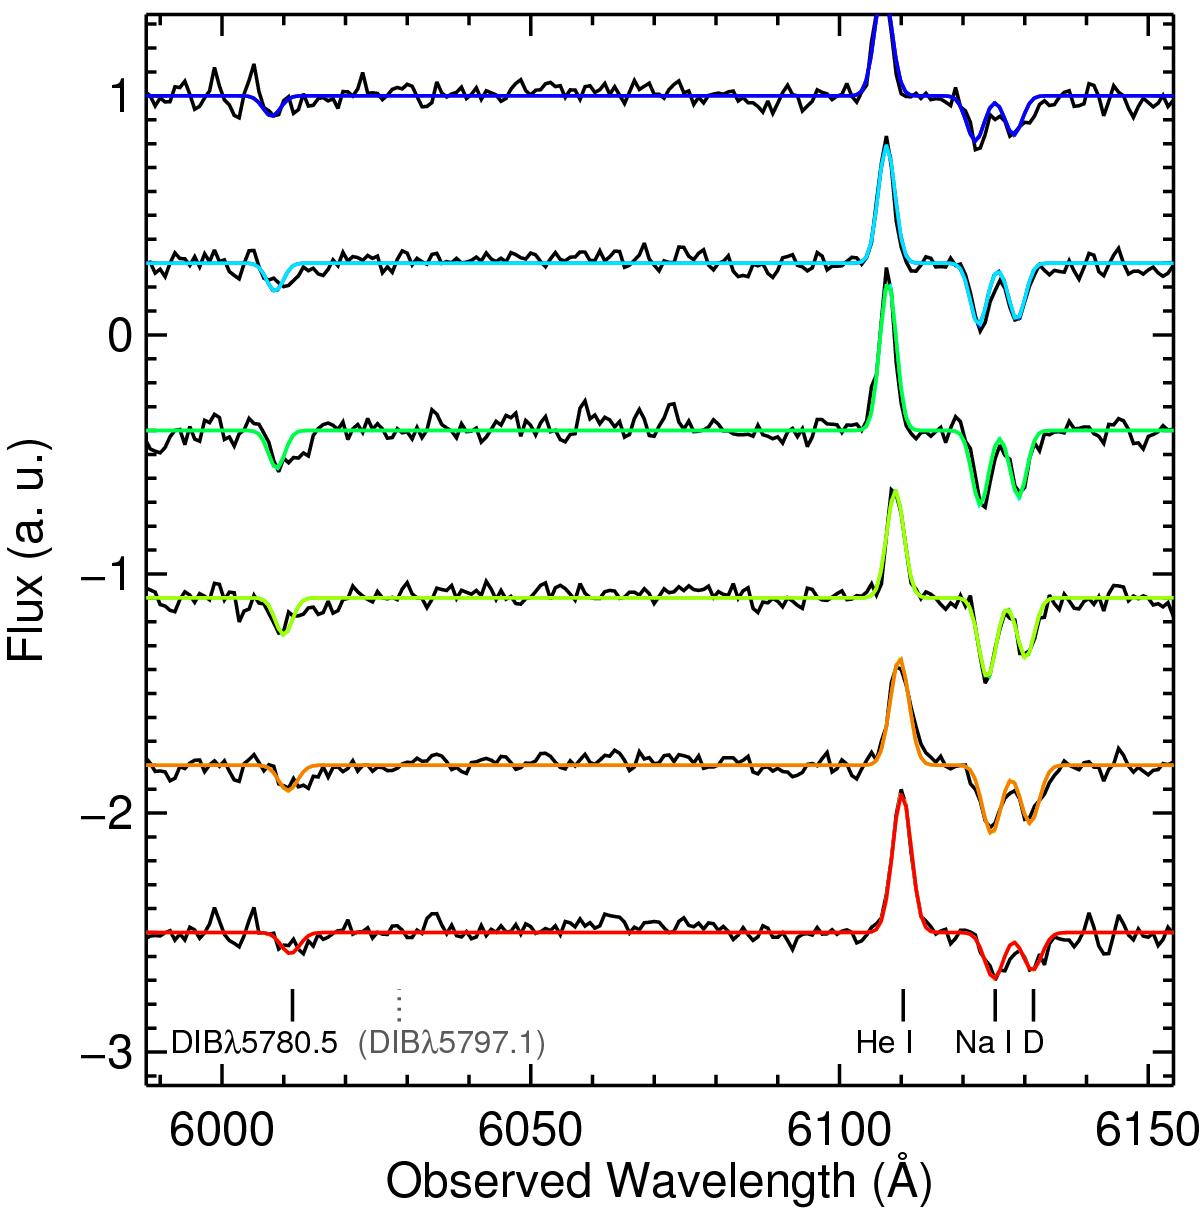
Spectra for the six half rings showing the fit in the area of the DIB, ordered from smallest top to largest bottom velocity and normalized to the median in the displayed spectral range. The expected locations of the discussed features are marked at the bottom of the figure. The colour code in the fits echoes the ordering in velocity. Likewise, the shift of the spectral features is clearly visible.
Current usage metrics show cumulative count of Article Views (full-text article views including HTML views, PDF and ePub downloads, according to the available data) and Abstracts Views on Vision4Press platform.
Data correspond to usage on the plateform after 2015. The current usage metrics is available 48-96 hours after online publication and is updated daily on week days.
Initial download of the metrics may take a while.