Fig. 1
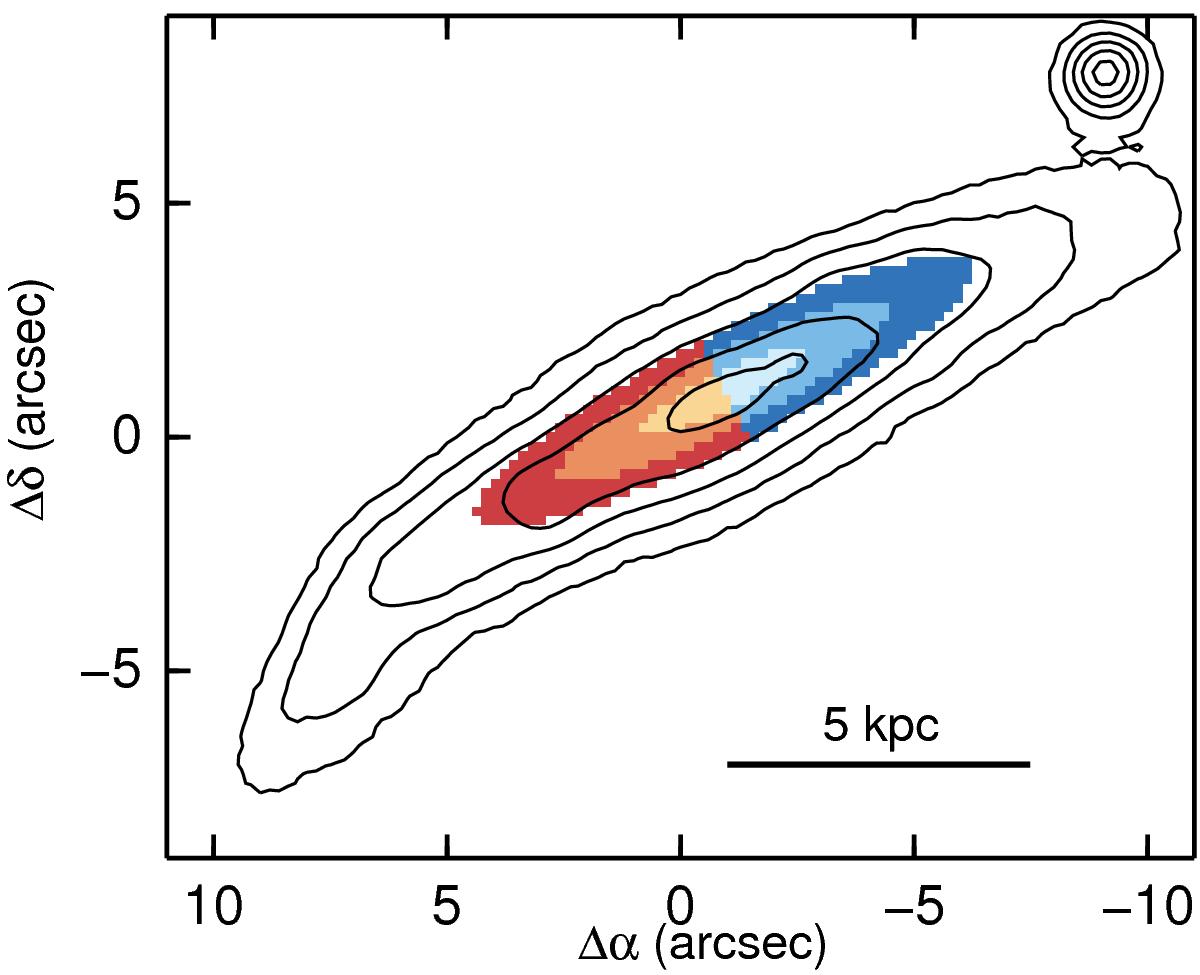
Apertures used to extract the high signal-to-noise spectra (i.e. the tiles). Each tile has been coloured differently using a palette that follows the blue-to-red velocity distribution within the galaxy. As a reference, the reconstructed white-light image is overplotted as contours in logarithmic stretching with 0.25 dex steps.
Current usage metrics show cumulative count of Article Views (full-text article views including HTML views, PDF and ePub downloads, according to the available data) and Abstracts Views on Vision4Press platform.
Data correspond to usage on the plateform after 2015. The current usage metrics is available 48-96 hours after online publication and is updated daily on week days.
Initial download of the metrics may take a while.