Fig. 2
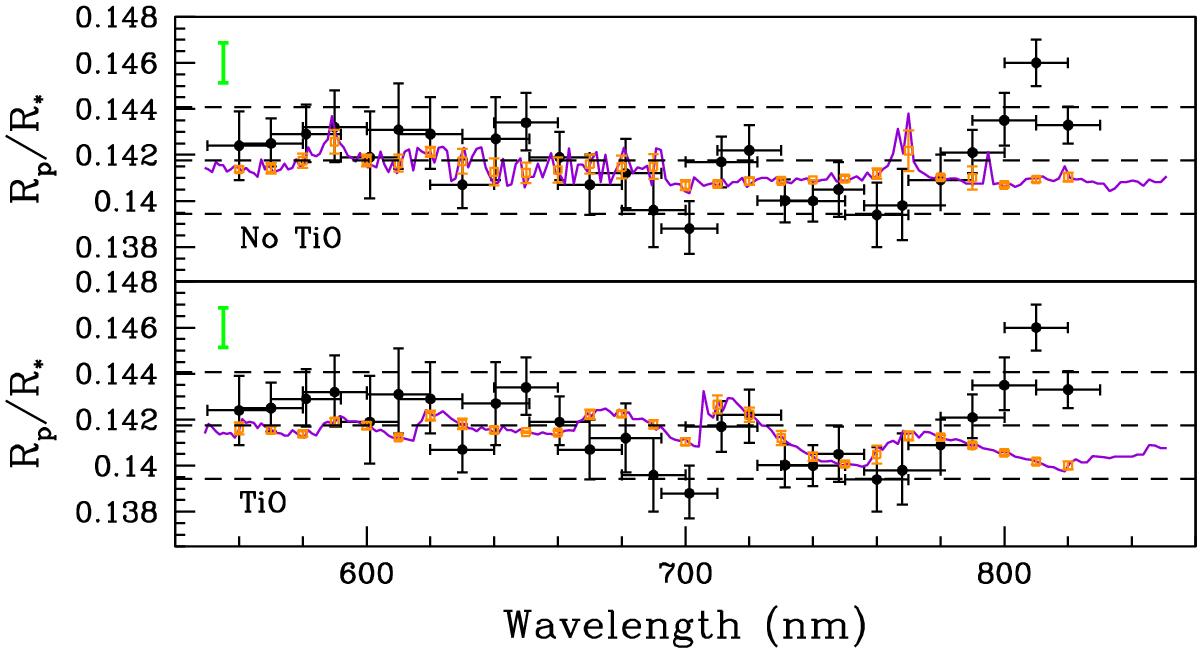
Transmission spectrum of WASP-19b as measured with FORS2 (black dots, with error bars) compared to two models of planetary atmospheres, one with no TiO (top panel) and one with a solar abundance of TiO (bottom panel), from Burrows et al. (2010) and Howe & Burrows (2012). We also estimated the mean value of the models in bin sizes of 20 nm (orange open squares). The dashed lines represent the weighted mean plus or minus three scale heights. Because of the overlapping spectral bins, only alternate pairs of transmission spectrum points contain unique information. The heavy, green bar on the left side shows the maximum error associated with unocculted spots.
Current usage metrics show cumulative count of Article Views (full-text article views including HTML views, PDF and ePub downloads, according to the available data) and Abstracts Views on Vision4Press platform.
Data correspond to usage on the plateform after 2015. The current usage metrics is available 48-96 hours after online publication and is updated daily on week days.
Initial download of the metrics may take a while.