Free Access
Fig. 1
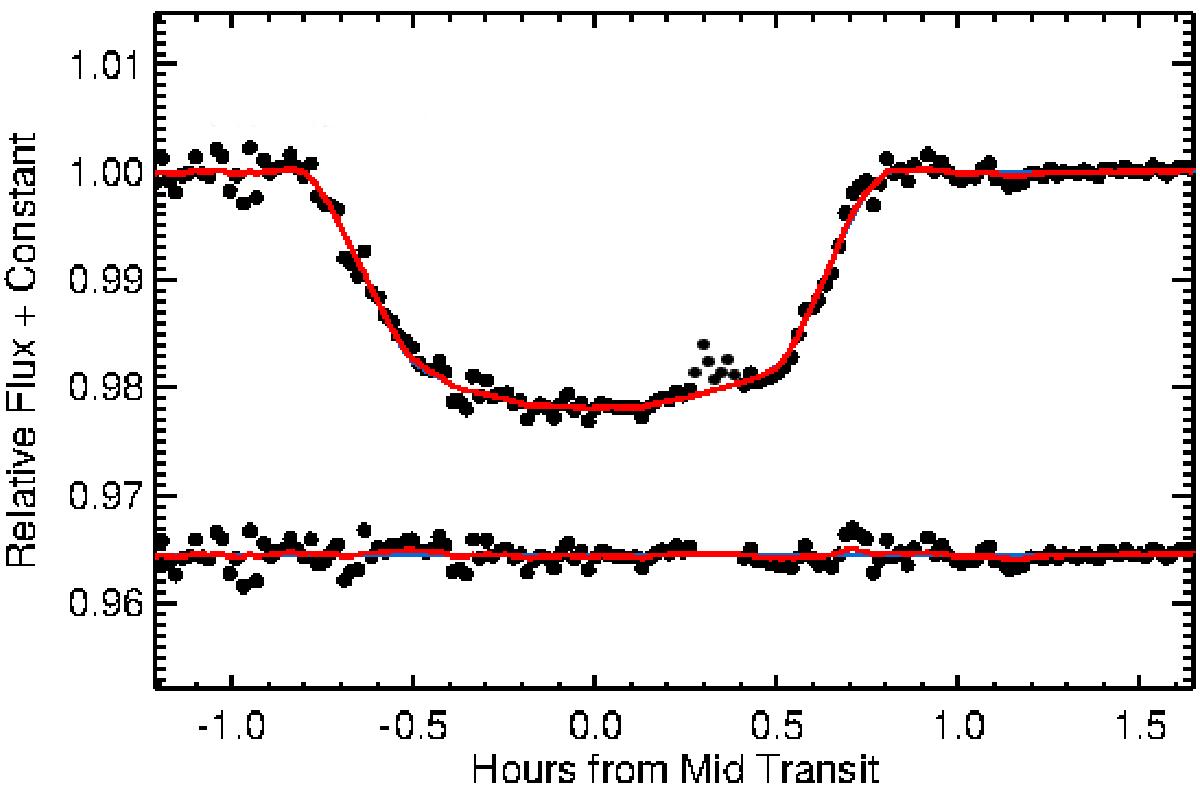
Normalised, detrended broadband light curve of WASP-19 compared with the best fit obtained with the red noise model included (red line). The residuals of the light curve compared to the models are also shown. In the residual plot, the possible spot-affected data points are removed, because they are given zero weight.
Current usage metrics show cumulative count of Article Views (full-text article views including HTML views, PDF and ePub downloads, according to the available data) and Abstracts Views on Vision4Press platform.
Data correspond to usage on the plateform after 2015. The current usage metrics is available 48-96 hours after online publication and is updated daily on week days.
Initial download of the metrics may take a while.