Free Access
Fig. 6
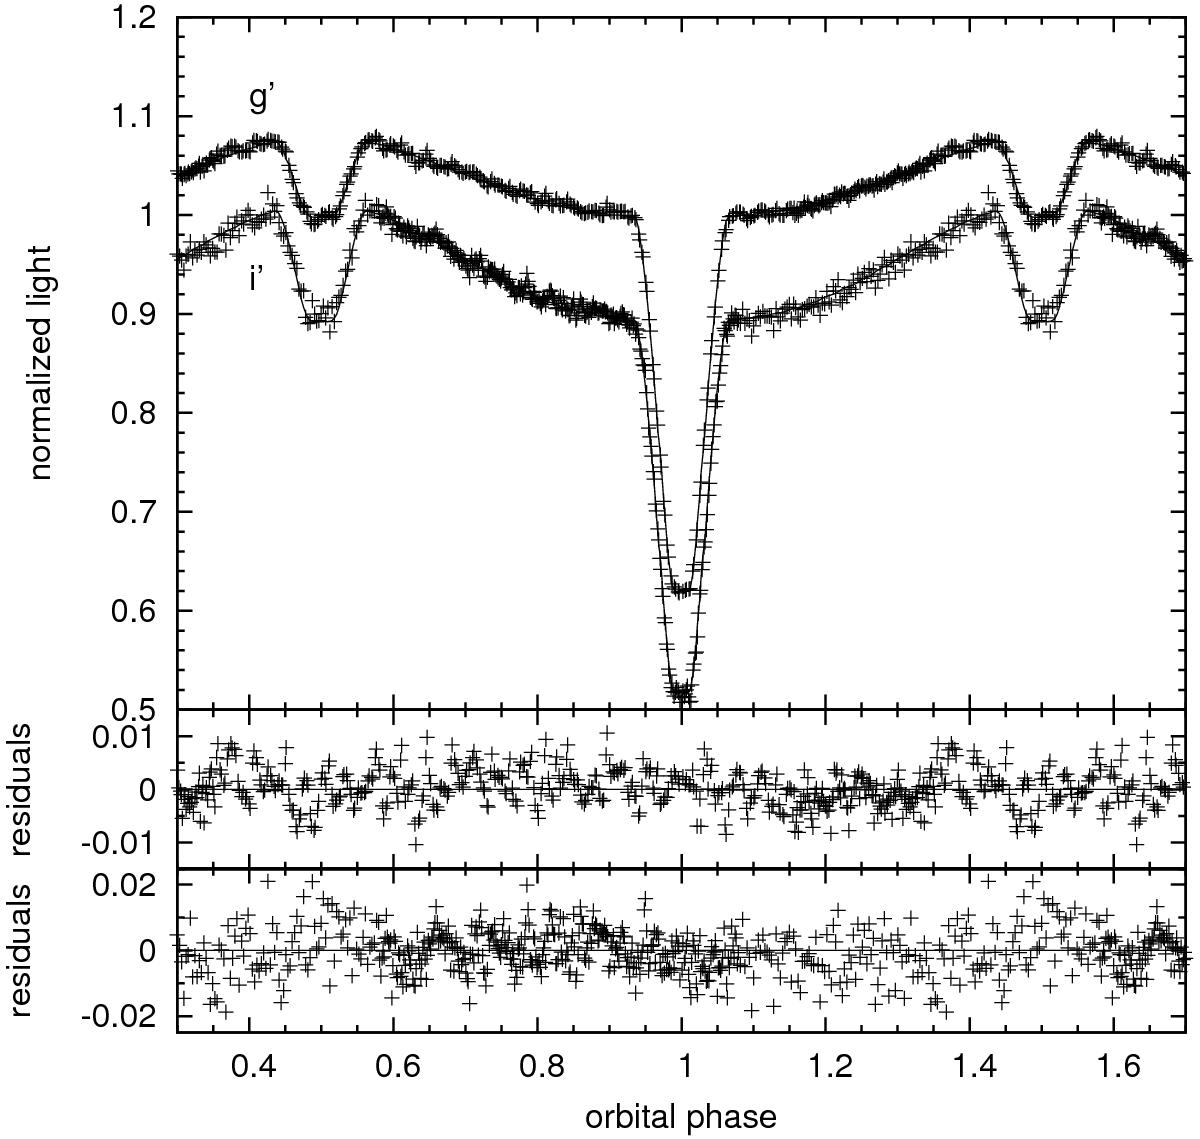
g′ and i′ light curves after the removal of the pulsation signal as explained in Sect. 4.1 together with the best-fitting light curve model. The residuals displayed in the two lower panels still show signs of low-amplitude pulsations.
Current usage metrics show cumulative count of Article Views (full-text article views including HTML views, PDF and ePub downloads, according to the available data) and Abstracts Views on Vision4Press platform.
Data correspond to usage on the plateform after 2015. The current usage metrics is available 48-96 hours after online publication and is updated daily on week days.
Initial download of the metrics may take a while.