Free Access
Fig. 4
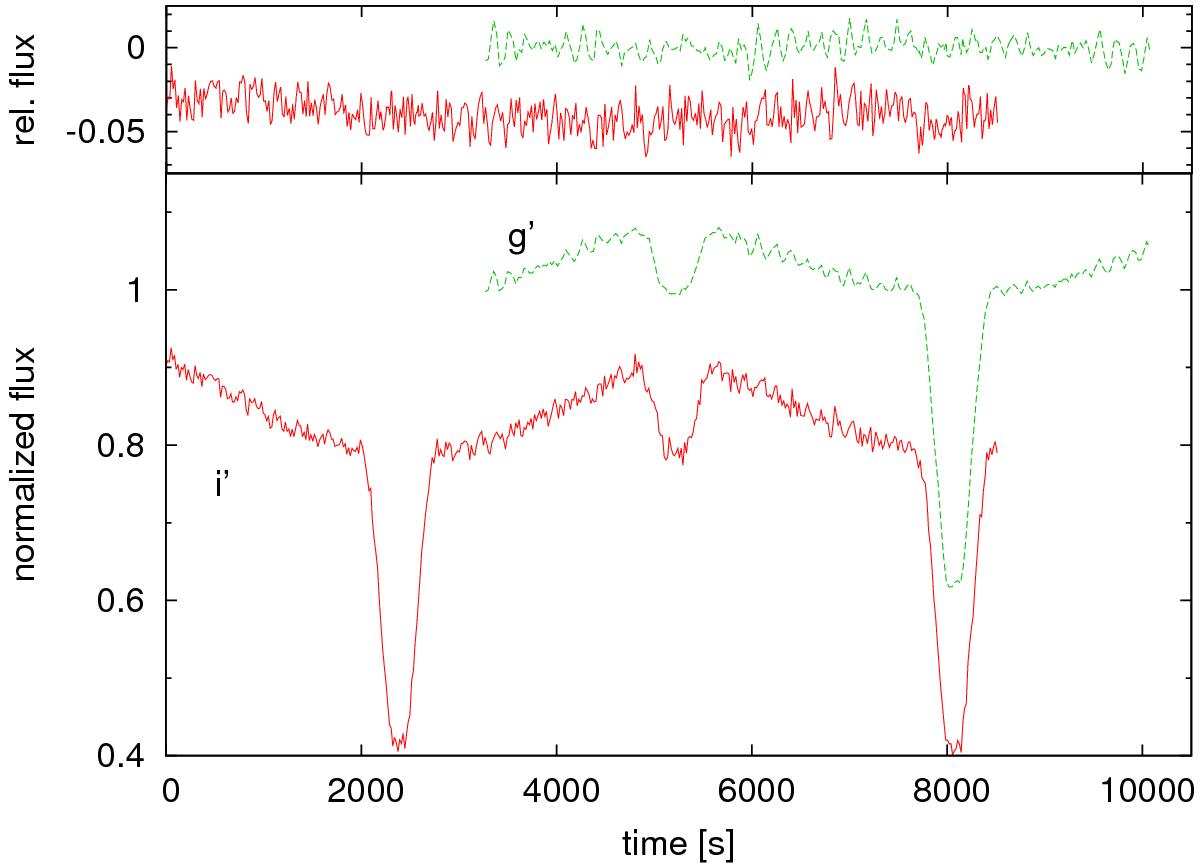
g′ (dashed line) and i′ (solid line) filter light curves of V2008-1753 taken with SOAR. The two light curves were taken in subsequent orbital cycles. The sub-figure shows the pulsation signal after the subtraction of the binary signal by the best-fitting light curve model.
Current usage metrics show cumulative count of Article Views (full-text article views including HTML views, PDF and ePub downloads, according to the available data) and Abstracts Views on Vision4Press platform.
Data correspond to usage on the plateform after 2015. The current usage metrics is available 48-96 hours after online publication and is updated daily on week days.
Initial download of the metrics may take a while.