Fig. 6
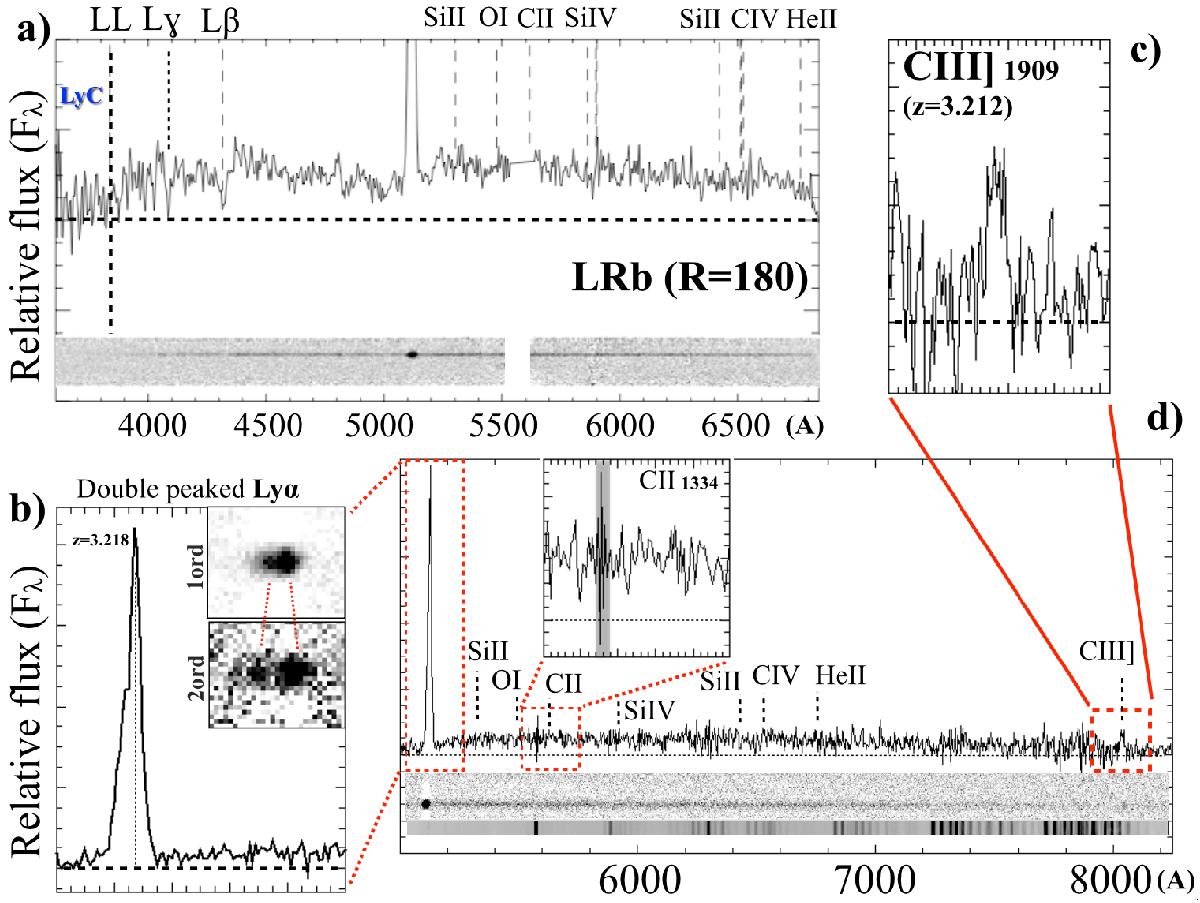
Low- (R = 180) and medium- (R = 580) resolution VIMOS spectra of Ion2 in panels a) and b). The two spectra overlap in the range (4800−6800 Å). Several typical low- and high-ionization atomic transitions are reported. The Lyα emission in both spectra and the Lyβ and Lyγ absorption features in the low-resolution spectrum (panel a)) are clear. The Lyman continuum blueward of the Lyman limit (LL) is indicated in panel a). Panel b) zoomed one-dimensional Lyα line extracted from the medium-resolution spectrum (R = 580). Its atypical blue asymmetric tail is clear. The insets in panel b) show the two-dimensional Lyα line at first (top) and second (bottom) order. The latter, with double spectral resolution, R ≃ 1200, clearly shows the double-peaked structure of the line. In panel c) a zoom-in of the position of C iii]λ1909 is shown at z = 3.212. The insets in panel d) show the region in which the C ii]λ1334 absorption line would lie: absorptions consistent with noise fluctuation are present (the gray stripe indicates the position of the sky emission line, 5577 Å).
Current usage metrics show cumulative count of Article Views (full-text article views including HTML views, PDF and ePub downloads, according to the available data) and Abstracts Views on Vision4Press platform.
Data correspond to usage on the plateform after 2015. The current usage metrics is available 48-96 hours after online publication and is updated daily on week days.
Initial download of the metrics may take a while.