Fig. 4
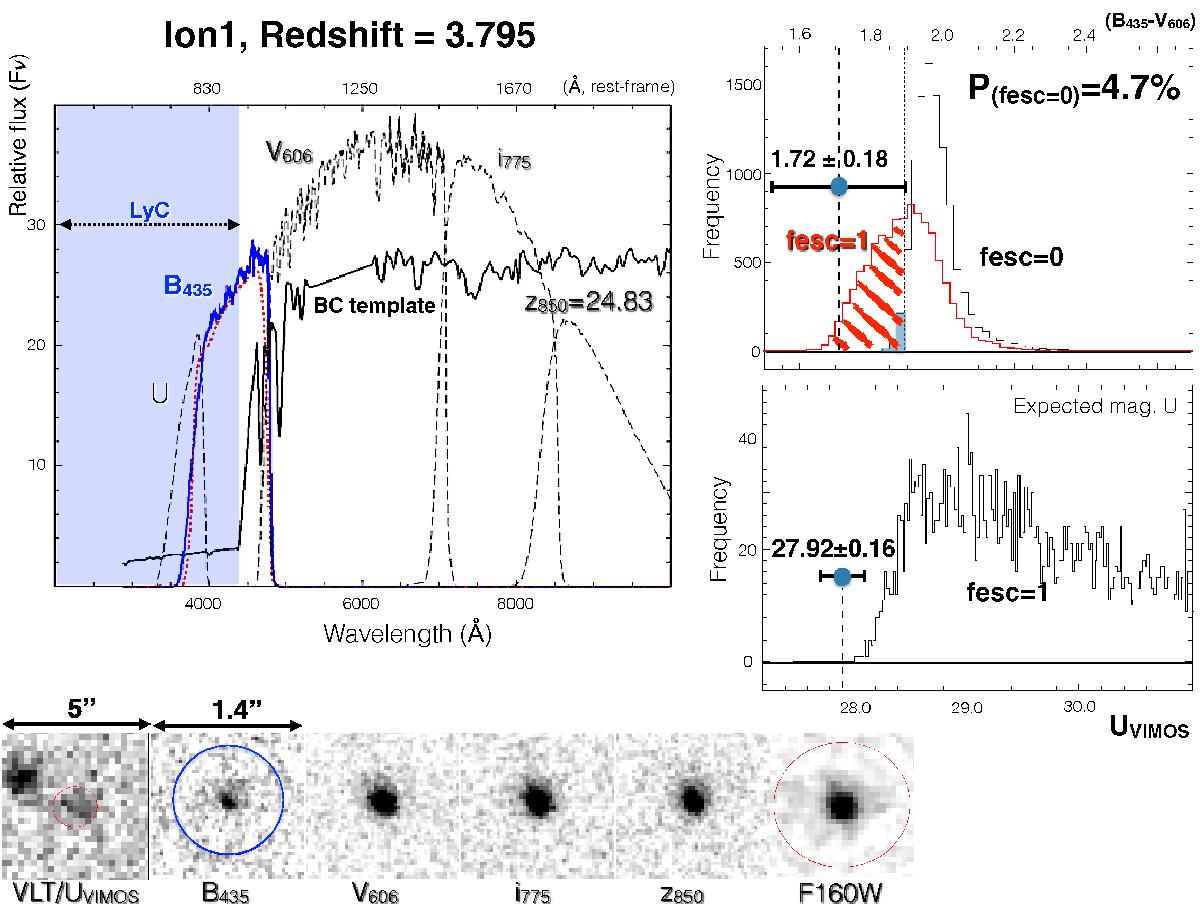
Summary of the Ion1 source. In the top-left panel the HST/ACS, VLT/U, and B-band filters are shown, superimposed to a BC galaxy template placed at the same redshift of Ion1. In particular, the solid blue and red dotted lines represent the HST/B435 and VLT/B band filters. The shaded transparent blue region marks the LyC region. More than half of the B435 and VIMOS/B bands probe the ionizing domain, while the U-band probes λ< 830 Å rest-frame. In the top right panel the simulated distribution of the (B435 − V606) colors are calculated assuming fesc = 0/1 and compared to the observed color of the source Ion1. The probability of a null fesc is very low. Similarly, the simulated U-band magnitude reproduces the observed one only marginally (middle right panel). The bottom panel shows the thumbnails for Ion1. The blue circle in the B435-band has a diameter of 1′′.
Current usage metrics show cumulative count of Article Views (full-text article views including HTML views, PDF and ePub downloads, according to the available data) and Abstracts Views on Vision4Press platform.
Data correspond to usage on the plateform after 2015. The current usage metrics is available 48-96 hours after online publication and is updated daily on week days.
Initial download of the metrics may take a while.