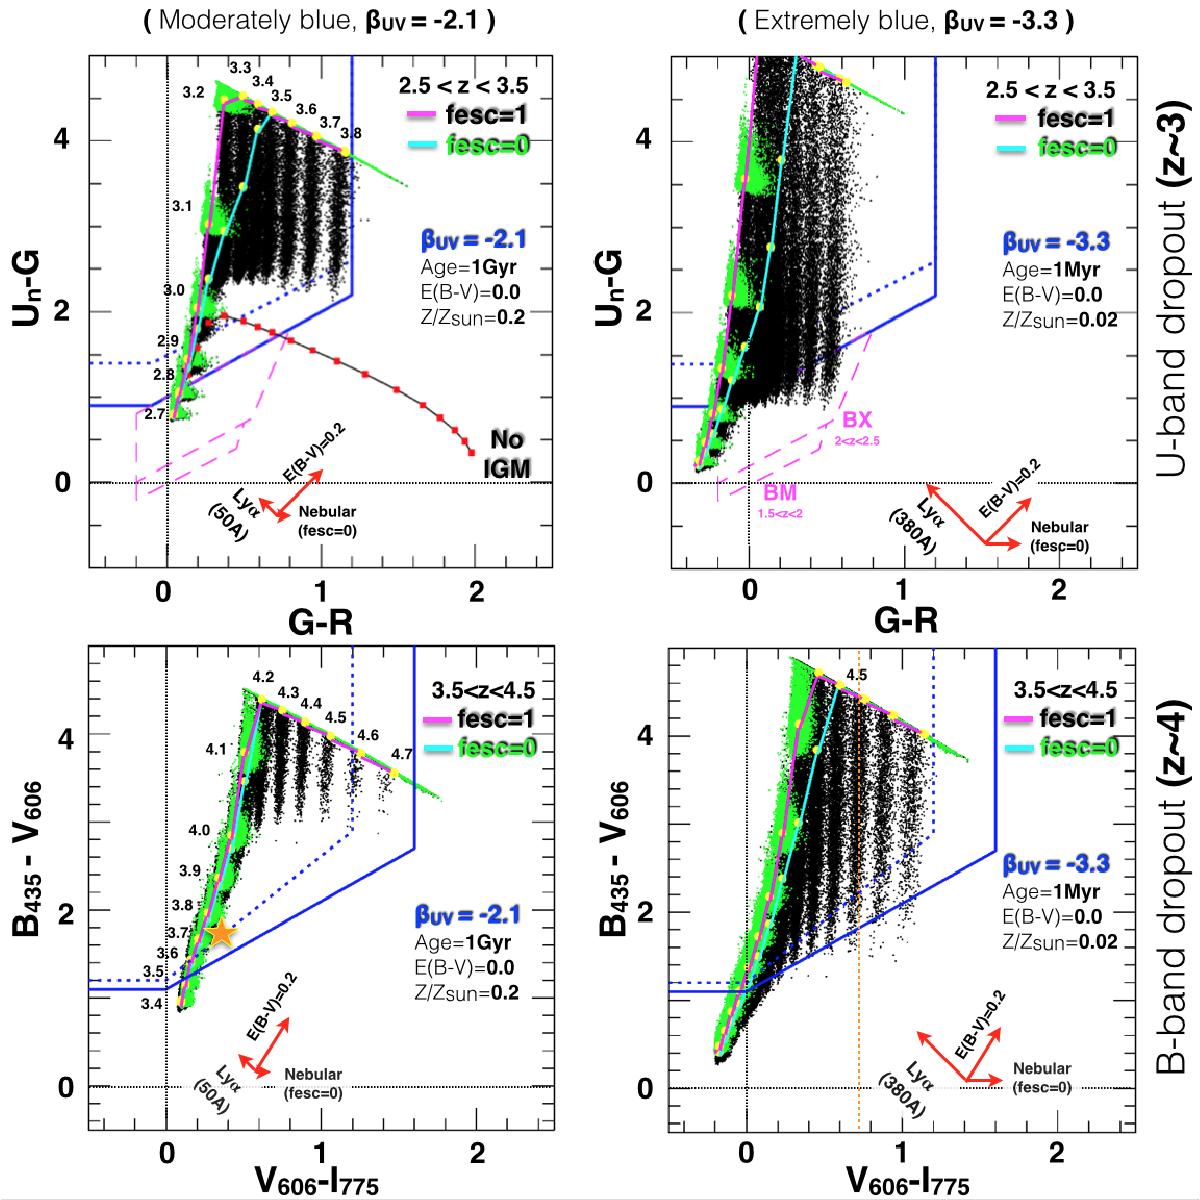
Fig. 3
Top panels: UnGR color planes with the typical selection regions for galaxies (solid blue line) in the redshift range 2.5 <z< 3.5 are shown for moderately blue (left) and extremely blue (right) galaxy templates. The effect of dust extinction and Lyα emission is shown with red arrows. The green clouds and black stripes correspond to fesc = 0 and fesc = 1, respectively, and are computed with redshift steps of 0.1 indicated at the left side. Magenta and cyan solid lines connect the barycenter of each cloud/stripe and represent the average color tracks (see text). In the top-left panel the (solid) black color track with filled (red) squares denotes the case in which the IGM is absent from the ionizing part of the spectrum, i.e., the transmission is equal to 1. The rightmost filled square symbol represents z = 4.5; squares have been plotted with dz = 0.1. The color track resembles the behavior of the flat models of Cooke et al. (2014) (see Sect. 3.1). Magenta dashed lines underline the BM and BX selection regions. Bottom panels: same as top panels, but in this case, the BVI (B435,V606,i775) color selections of galaxies expected to lie in the redshift range 3.4 <z< 4.5 are shown (solid blue lines). In the bottom-left panel the star indicates the position of the Lyman-continuum emitters Ion1 at z = 3.795 (see text). In the bottom right panel the vertical orange dotted line highlights the bending of the black stripe at z = 4.5 when ionizing emission also affects the V606-band, visible as a slightly bluer V606 − i775 color for the higher IGM transmission cases (see text). The effect of the LyC leakage on colors decreases with increasing redshift (passing from U-band to B-band dropout selection methods) as a result of redshift evolution of the mean free path of ionizing photons. In all quadrants the triplets of red arrows mark the direction and magnitude of the color modification as a result of the Lyα emission, nebular continuum (affecting only the fesc = 0 case, green points), and the dust attenuation, E(B − V).
Current usage metrics show cumulative count of Article Views (full-text article views including HTML views, PDF and ePub downloads, according to the available data) and Abstracts Views on Vision4Press platform.
Data correspond to usage on the plateform after 2015. The current usage metrics is available 48-96 hours after online publication and is updated daily on week days.
Initial download of the metrics may take a while.