Free Access
Fig. 2
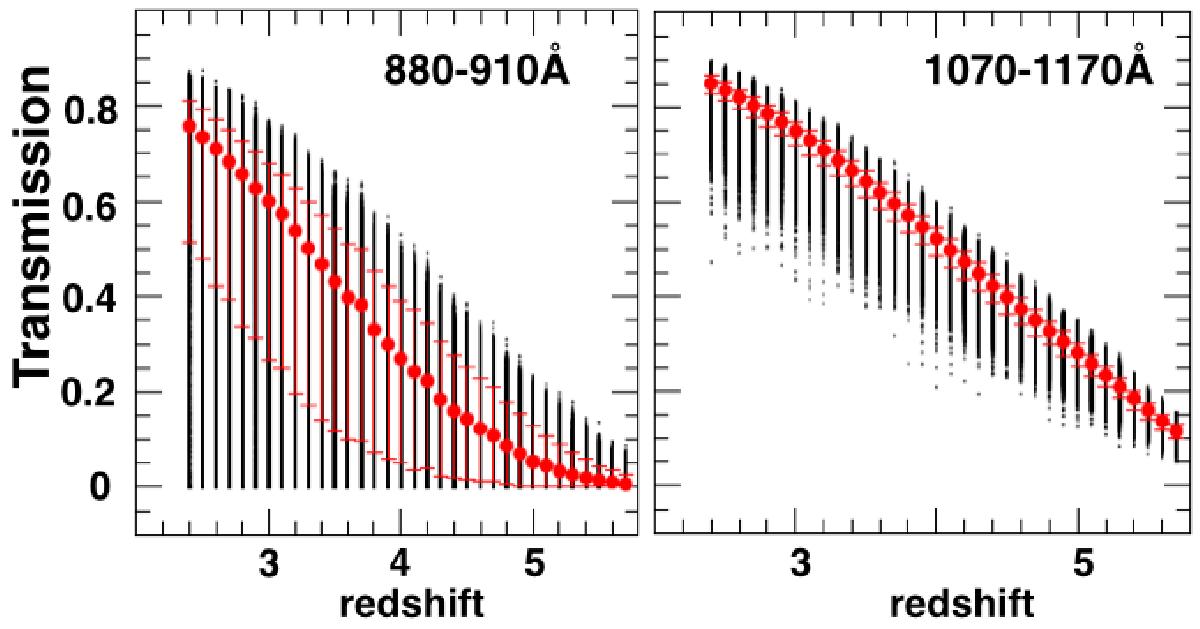
IGM transmissions as a function of redshift calculated in the wavelength intervals 880−910 Å (left) and 1070−1170 Å (right). At each redshift, 10 000 line of sights have been computed (black points), and the medians with the central 68% intervals are also shown (red filled circles with errorbars).
Current usage metrics show cumulative count of Article Views (full-text article views including HTML views, PDF and ePub downloads, according to the available data) and Abstracts Views on Vision4Press platform.
Data correspond to usage on the plateform after 2015. The current usage metrics is available 48-96 hours after online publication and is updated daily on week days.
Initial download of the metrics may take a while.