Fig. 4
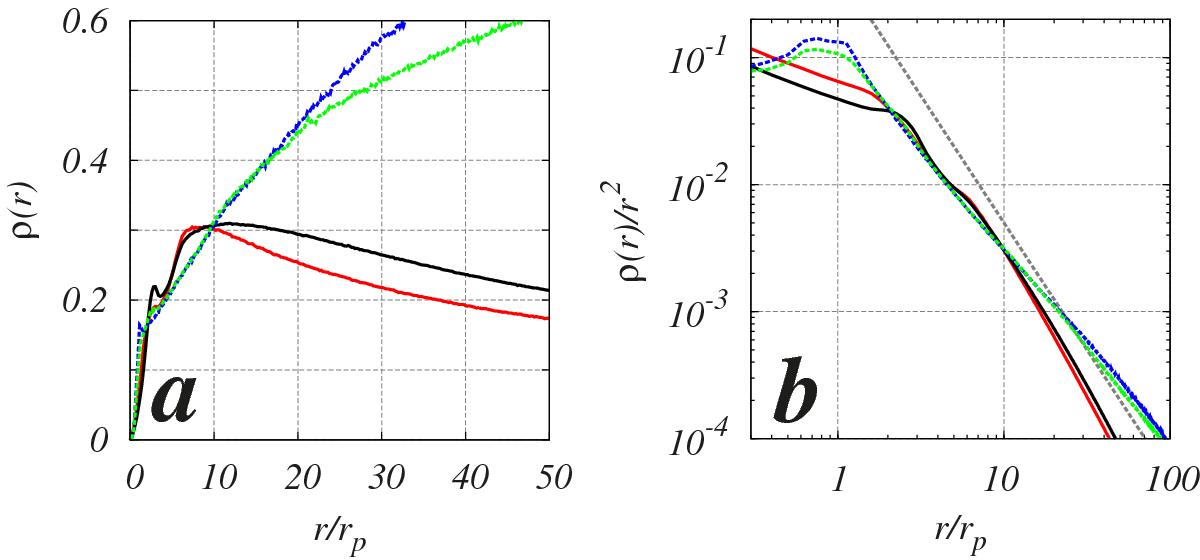
a) Stationary radial density ρ(r) ∝ dN/ dr from the Kepler map at J = 0.005 with u = 17 at time tS (red curve) and u = 0.035 at time tu ≈ 4 × 10⁸Tp (black curve); data from the dark map at mp/M = 10-3 are shown by the blue curve at u = 17 and time tS for the Sun-Jupiter case, and by the green curve at u = 0.035 and tS for the SMBH; the normalization is fixed as ![]() , rp = 1. b) Volume density ρv = ρ/r2 from the data of panel a), the dashed line shows the slope −2.
, rp = 1. b) Volume density ρv = ρ/r2 from the data of panel a), the dashed line shows the slope −2.
Current usage metrics show cumulative count of Article Views (full-text article views including HTML views, PDF and ePub downloads, according to the available data) and Abstracts Views on Vision4Press platform.
Data correspond to usage on the plateform after 2015. The current usage metrics is available 48-96 hours after online publication and is updated daily on week days.
Initial download of the metrics may take a while.