Fig. 3
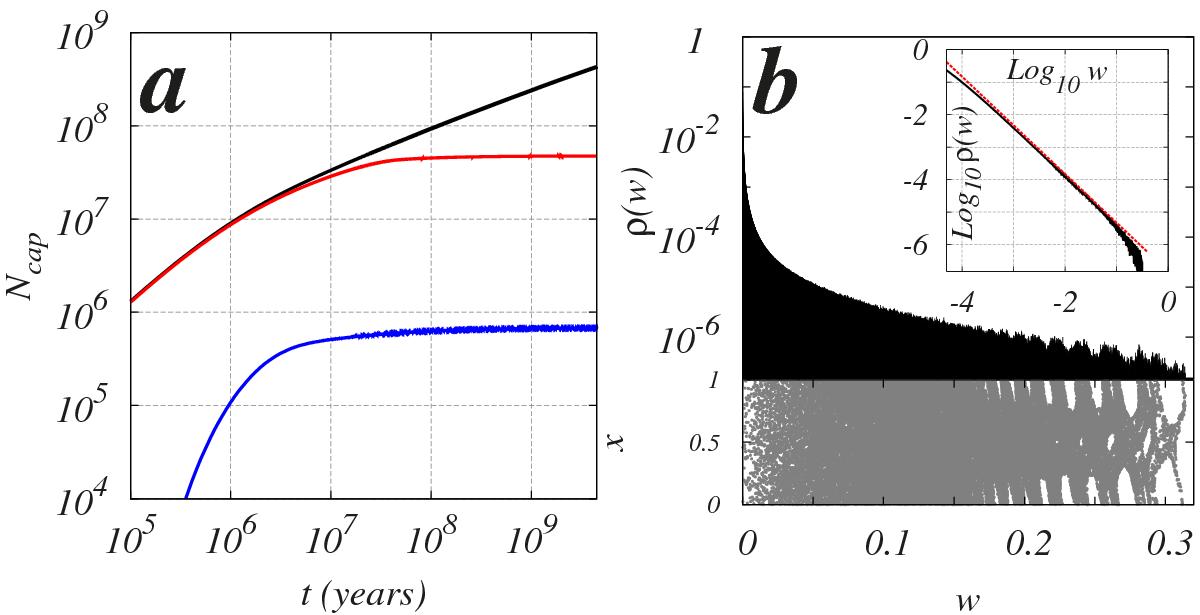
a) Number Ncap of captured DMPs as a function of time t in years for the energy range w> 0 (black curve), w> 4 × 10⁻⁵ corresponding to half the distance between Sun and the Alpha Centauri system (red curve), w> 1/20 corresponding to r< 100 AU (blue curve); NJ = 4 × 10¹¹ DMPs are injected during SS lifetime tS; data are obtained from the map (2) at J = 0.005, u = 17 corresponding to the Sun-Jupiter case. b) Top part: density distribution ρ(w) ∝ dN/ dw in energy at time tS (normalized as ![]() ), bottom part: Poincaré section of the map (2); inset: density distribution of the captured DMPs in w (black curve), the red line shows the slope –3/2.
), bottom part: Poincaré section of the map (2); inset: density distribution of the captured DMPs in w (black curve), the red line shows the slope –3/2.
Current usage metrics show cumulative count of Article Views (full-text article views including HTML views, PDF and ePub downloads, according to the available data) and Abstracts Views on Vision4Press platform.
Data correspond to usage on the plateform after 2015. The current usage metrics is available 48-96 hours after online publication and is updated daily on week days.
Initial download of the metrics may take a while.