Fig. 2
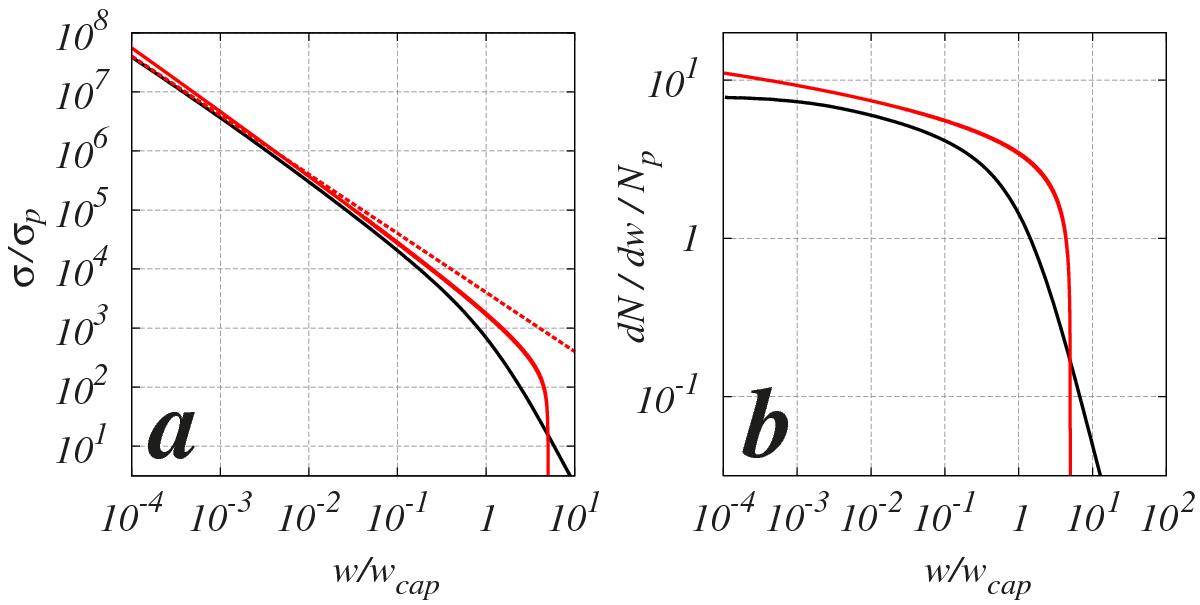
a) Dependence of the capture cross-section σ on DMP energy w for Sun-Jupiter (black curve, data from Ref. (8)) and for the Kepler map at J = 0.005 (red curve); the dashed line shows the dependence σ ∝ 1/|w |. b) Dependence of the rescaled captured number of DMPs on energy w for the models of the left panel. Here wcap = 0.001.
Current usage metrics show cumulative count of Article Views (full-text article views including HTML views, PDF and ePub downloads, according to the available data) and Abstracts Views on Vision4Press platform.
Data correspond to usage on the plateform after 2015. The current usage metrics is available 48-96 hours after online publication and is updated daily on week days.
Initial download of the metrics may take a while.