Fig. 3
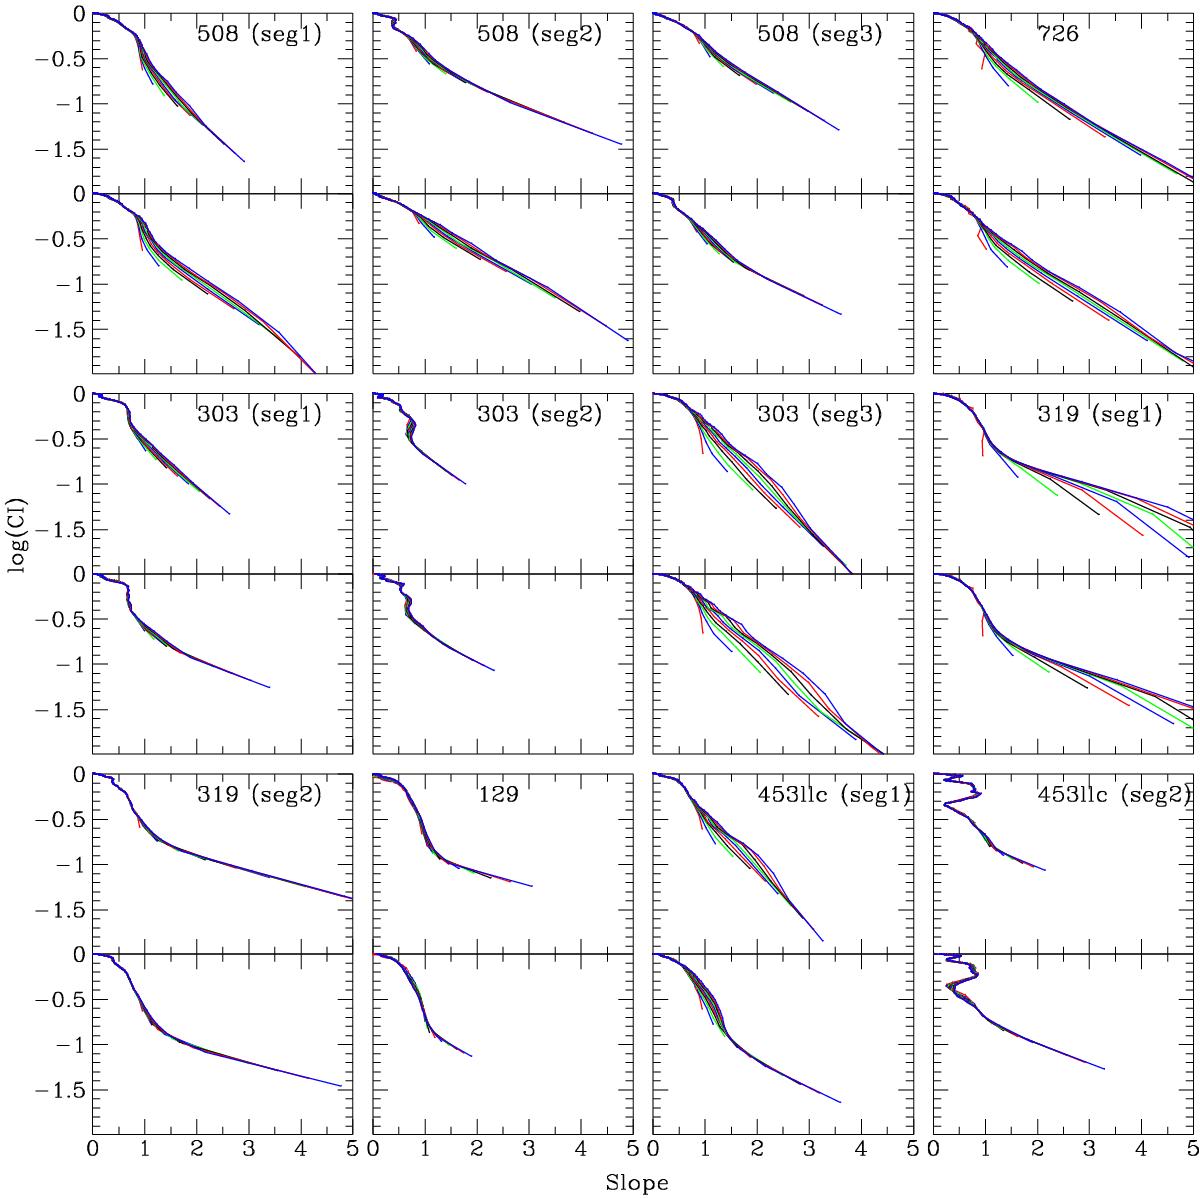
CI diagrams for different segments of the blazar light curve for different embedding dimensions, same as in Fig. 2: the last 3 digits of the dataset (see Table 1) are indicated. The upper panel of each box is for the real dataset, the lower one is for the phase-randomized surrogate. None of the diagrams shows clear indication for a strange attractor of low dimension, especially considering that the “surrogate” diagrams are very similar to the ones of the real data.
Current usage metrics show cumulative count of Article Views (full-text article views including HTML views, PDF and ePub downloads, according to the available data) and Abstracts Views on Vision4Press platform.
Data correspond to usage on the plateform after 2015. The current usage metrics is available 48-96 hours after online publication and is updated daily on week days.
Initial download of the metrics may take a while.