Fig. 4
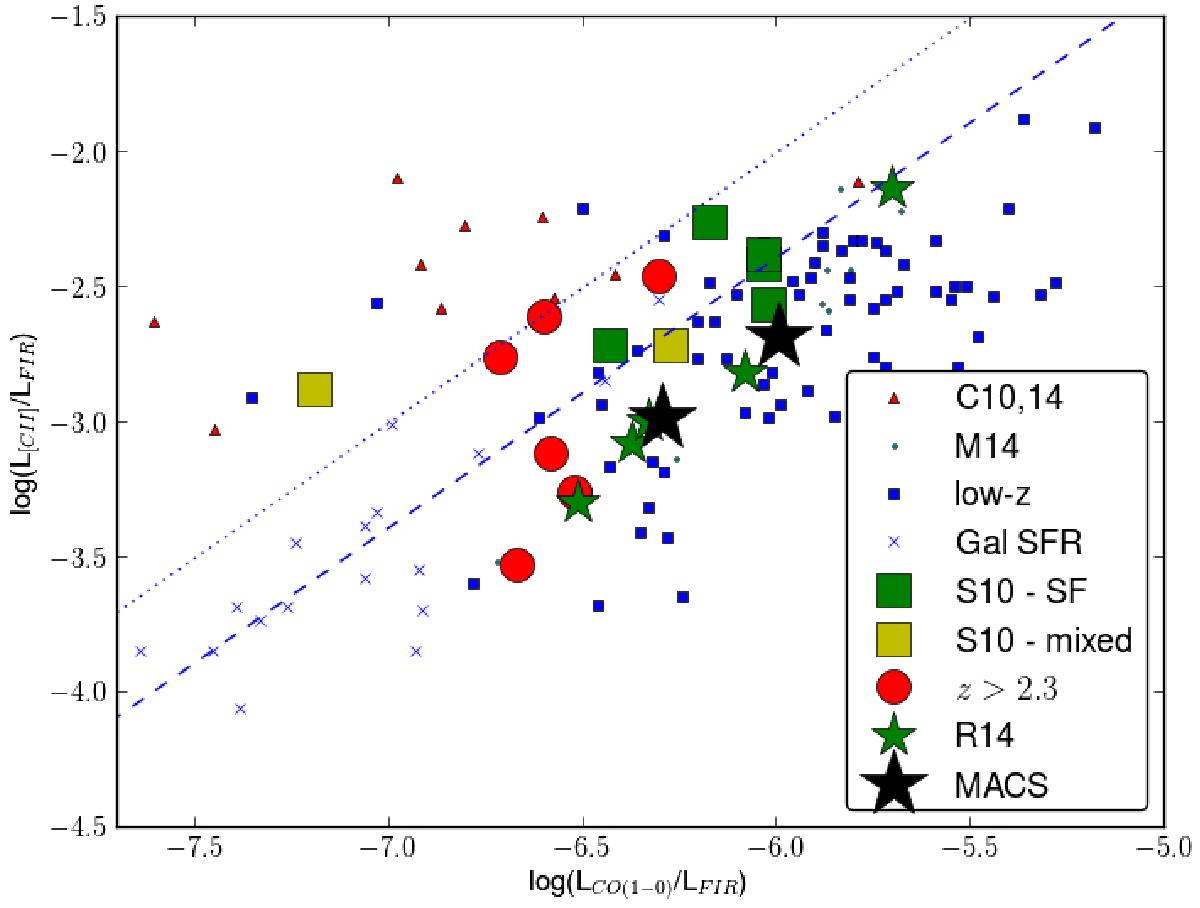
L[CII]/LFIR versus LCO/LFIR with MACS J0451+0006 (large, black stars; cf. Fig. 3) and other samples. Small symbols show low-z star-forming galaxies and AGN, large symbols z> 2 galaxies from the following papers: C10,14: Cormier et al. (2010); Cormier et al. (2014), M14: Magdis et al. (2014), S10: Stacey et al. (2010), R14: Rawle et al. (2014), and various z> 2 galaxies from the literature. Crosses show Galactic SF regions with low IR luminosities below the range plotted in Fig. 3. The dashed (dotted) line shows a ratio of L[CII]/LCO = 4.1 × 10³ (104).
Current usage metrics show cumulative count of Article Views (full-text article views including HTML views, PDF and ePub downloads, according to the available data) and Abstracts Views on Vision4Press platform.
Data correspond to usage on the plateform after 2015. The current usage metrics is available 48-96 hours after online publication and is updated daily on week days.
Initial download of the metrics may take a while.